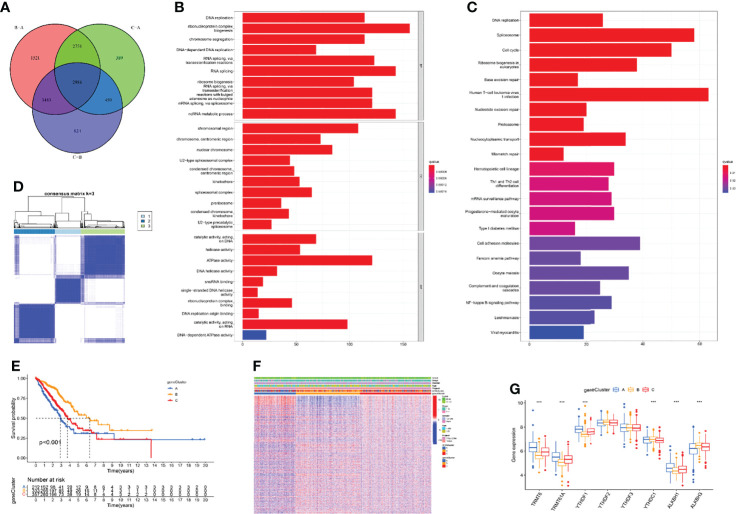
Figure 4.
Identification of three m1A gene clusters. (A) 2986 DEGs of three m1A modification patterns were shown by Venn diagram. (B, C) GO and KEGG results revealed the potential function of 1787 prognosis-related DEGs. (D) Consensus clustering of m1A gene clusters for LUAD patients in the training cohort. (E) Survival outcome prediction of three m1A gene clusters in the training cohort. (F) Heatmap of consensus clustering of 1787 prognosis-related DEGs. (G) The different expression levels of m1A regulators in three m1A gene clusters (***P < 0.001).

