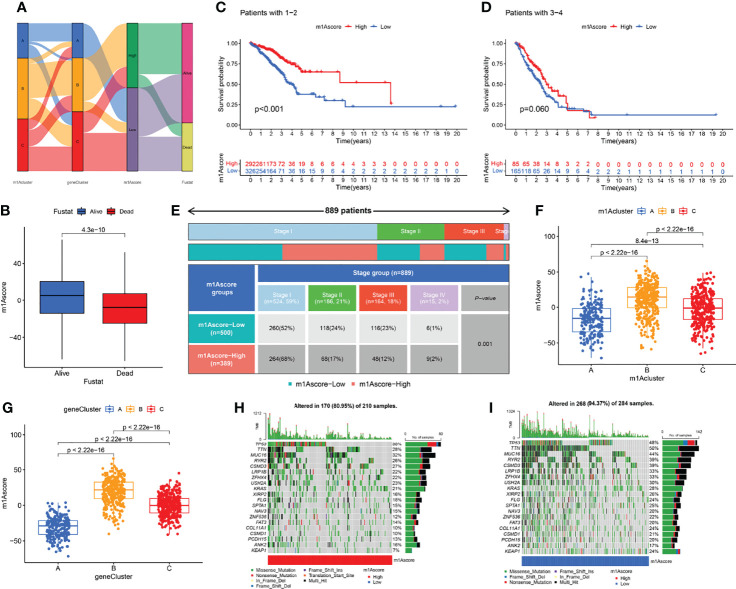
Figure 5.
Clinical features in different m1A score groups. (A) Alluvial plots depicted the correspondence in m1A clusters, m1A gene clusters, m1A score, and the survival status of patients in LUAD. (B) The differences of fustat in different m1A score groups. (C–E) Kaplan-Meier curves uncovered differences in m1A scores among LUAD patients at different pathological stages. (F, G) The differences of m1A score among three m1A modification patterns and three m1A gen clusters. (H, I) The differences of somatic mutation frequency in tumor genomes based on the grouping of m1A scores.

