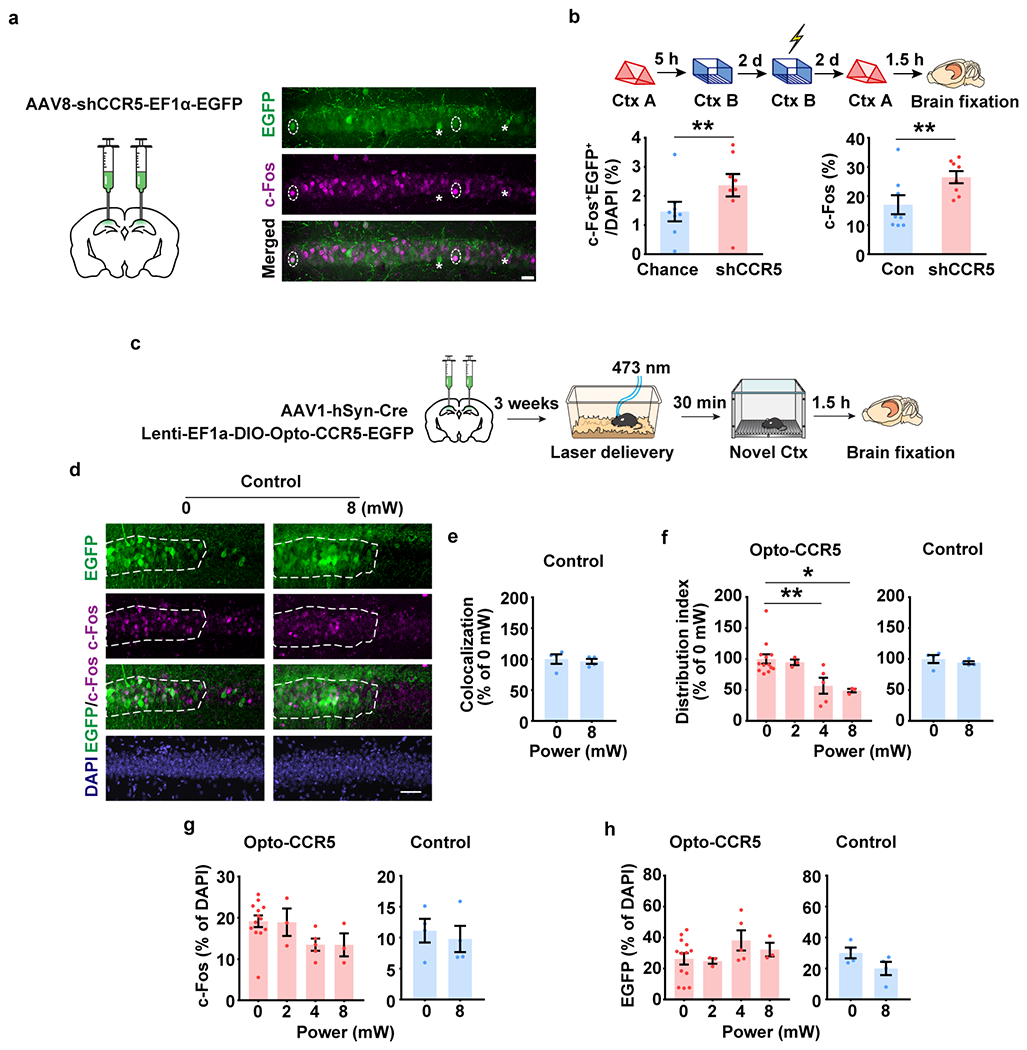
Extended Data Fig. 7|. CCR5 regulate memory allocation.

a, b, Ccr5 knockdown enhanced memory allocation.
a, Schematics of AAV8-shRNA-CCR5-Ef1α-EGFP injection, and representative images of c-Fos and EGFP staining. Two EGFP+c-Fos+ cells were labelled by dotted line circle and two EGFP+c-Fos− cells were labelled by asterisk. Scale bar, 20 μm.
b, dCA1 neurons with Ccr5 knockdown had a higher probability of expressing c-Fos after a memory test in context A. Left: The percentage of c-Fos+EGFP+ cells in total (DAPI). Right: percentage of c-Fos+ cells in EGFP− cells (Con) or in EGFP+ cells with Ccr5 knockdown (shCCR5) (n=8 mice, **P < 0.01, paired t-test).
c-h, Expression of c-Fos and Opto-CCR5 or EGFP control in dCA1 (Opto-CCR5 0 mW n=13, 2 mW n=3, 4 mW n=5, 8 mW n=3 mice; EGFP control n=4 mice per group).
d, Representative images of colocalization between c-Fos and EGFP control after light stimulation and novel context exposure. Scale bar, 50 μm.
e, Colocalization between c-Fos+ cells and EGFP+ cells after normalization to chance level.
f, Quantification of c-Fos distribution in EGFP+ and EGFP− cells in the Opto-CCR5-EGFP or EGFP control group (*P < 0.05, **P < 0.01, one-way ANOVA).
g, Percentage of c-Fos positive cells (normalized to cells with DAPI staining) in dCA1 with light stimulation of different power levels.
h, Percentage of EGFP expression cells (normalized to cells with DAPI staining) in dCA1with light stimulation of different power levels.
All results shown as mean ± s.e.m.
