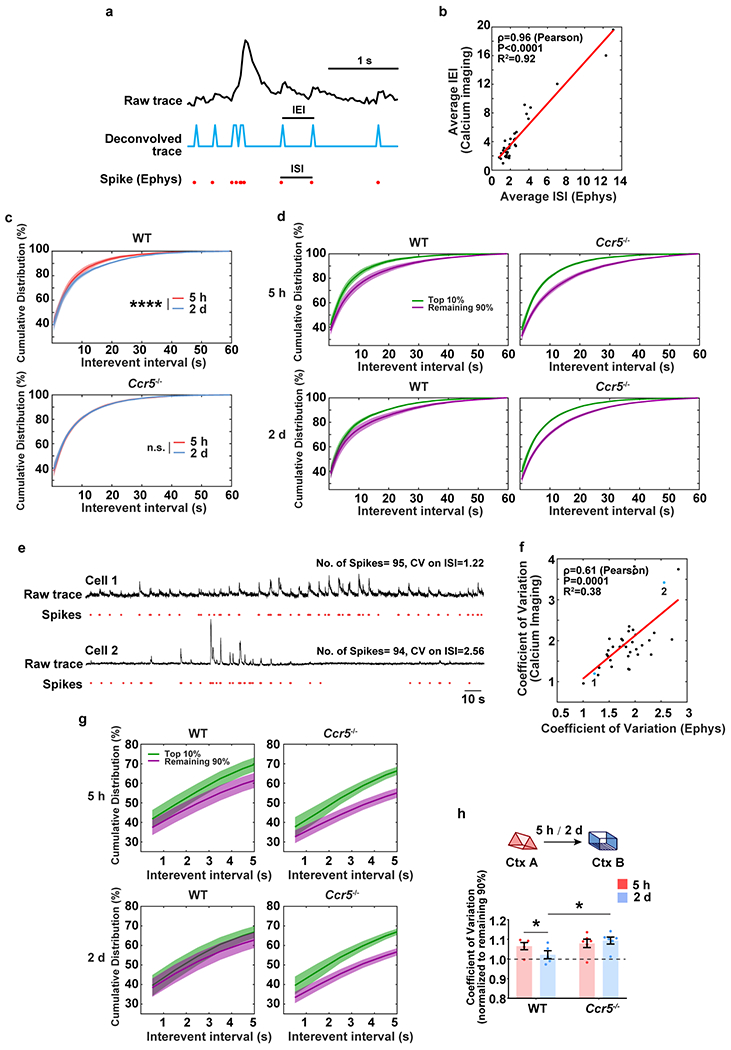
Extended Data Fig. 8|. Analysis of the cumulative distribution of inter-event intervals recorded with miniscopes in WT and Ccr5 KO mice.

a, Schematics used to extract spike information from raw traces of calcium imaging. Plot shows a 3s chunk of data from a single neuron using GCaMP6f calcium imaging and loose-seal cell-attached electrophysiological (Ephys) recordings.
b, The average inter-event interval (IEI, from miniscope recordings) is highly correlated with the average inter-spike interval (ISI, by Ephys) (n=36 cells; R2=0.92, P < 0.0001, ρ=0.96, Pearson’s correlation coefficient).
c, Cumulative distribution of IEI of the top 10% most active neurons (in Ctx A). The top 10% most active neurons from WT mice showed a significantly different distribution of IEI 5h compared to 2d after the context A exposure. In contrast, this subset of cells showed a similar pattern for both time intervals in Ccr5−/− mice (WT n=5, Ccr5−/− n=6 mice; ****P < 0.0001, Kolmogorov–Smirnov test).
d, Cumulative distribution of IEIs of the top 10% most active neurons and the remaining 90% neurons (in Ctx A) at 5h or 2d after the context A exposure (WT n=5, Ccr5−/− n=6 mice).
e, Although neurons may have similar number of spikes during a certain time period of recording, the difference of their coefficient of variation unveils different firing patterns ranging from regular firing (Cell 1) to bursty firing (Cell 2).
f, The coefficient of variation of IEI (by calcium imaging) highly correlates with the coefficient of variation of ISI (by Ephys) (n=36 cells; R2=0.38, P=0.0001, ρ=0.61, Pearson’s correlation coefficient).
g, Cumulative distribution of IEI (the first 5s, zoom-in from d) of the top 10% highly active neurons and the remaining 90% neurons (in Ctx A) at 5h or 2d after the context A exposure. The difference between the top 10% most active and the remaining 90% neurons in Ctx A was strongly reduced from 5h to 2d in WT mice but not in Ccr5−/− mice (WT n=5, Ccr5−/− n=6 mice).
h, Coefficient of variation from the top 10% most active neurons (normalized to the remaining 90%). WT or Ccr5−/− mice were exposed to Ctx B 5h or 2d after Ctx A. WT mice showed a significant decrease in the coefficient of variation of IEI comparing the data for the 2d and 5h intervals, while Ccr5−/− mice had similar coefficient of variation of IEI in both intervals (WT n=5, Ccr5−/− n=6 mice; *P < 0.05, two-way repeated measures ANOVA).
All results shown as mean ± s.e.m.
