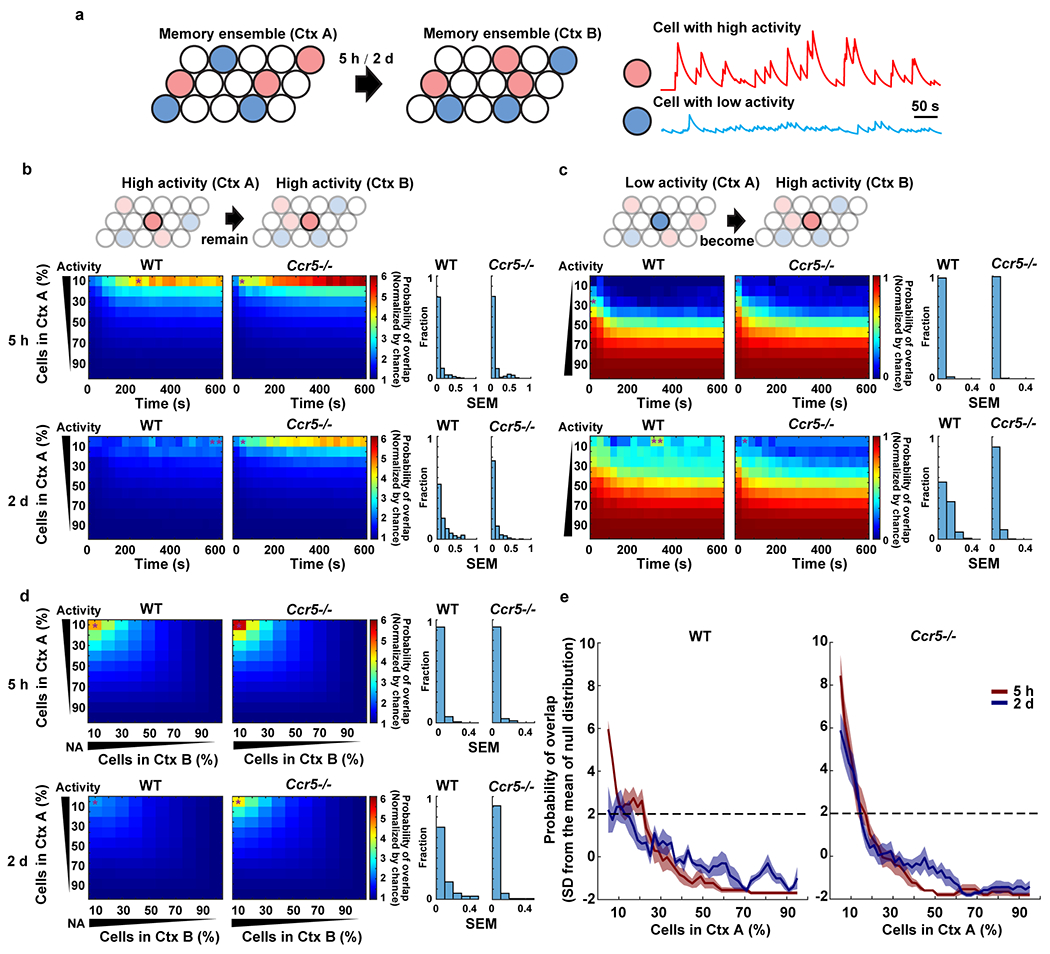
Extended Data Fig. 9|. Analysis of neuronal activity and overlap probability in WT and Ccr5 KO mice.

a, Schematics showing that cells in neuronal ensembles can be sorted into cells with high neuronal activity (red) and low activity (blue), based on their average activity during the exploration of Ctx A and Ctx B which were separated by either a 5h or 2d interval.
b, c, Left: Probability of overlap (averaged across mice) between subsets of cells with different levels of activity (y axis) during exploration of Ctx A and Ctx B, in WT and Ccr5−/− mice across time in Ctx B (x axis). Color bars refer to normalized probabilities (chance=1). Cumulative values were used for x and y axis (e.g., for x axis, 200s means 0-200s; for y axis, 30 refers to the neurons within the top 30% of high (b) or low (c) activity). Right: the distribution of SEM across mice for the figures on the left. Asterisks (in the probability of overlap figures) represent the maximum SEM from each plot (WT n=5, Ccr5−/− n=6 mice).
b, Probability of overlap between high activity cells in Ctx A and high activity cells in Ctx B in WT and Ccr5−/− mice. Note that the top 10% high activity cells in Ctx A are very likely to remain within the top 10% high activity cells in Ctx B 5h later for both WT and Ccr5−/− mice. In contrast, this subset of cells was reactivated around chance levels 2d later in Ctx B in WT mice, but not in Ccr5−/− mice. In the Ccr5−/− mice this subset of cells was still very likely to remain within the top 10% high activity cells in Ctx B.
c, Probability of overlap between low activity cells in Ctx A and high activity cells in Ctx B in WT and Ccr5−/− mice. In contrast to high activity cells in Ctx A, the low activity cells in Ctx A were less likely (compared to chance) to be within the high activity cells in Ctx B.
d, The probability of overlap between different ensembles (Ctx A and Ctx B) was sorted by neuronal activity in Ctx A and Ctx B, with a 5h or 2d interval between the two contextual exposures. Cells were sorted in percentages from top to bottom mean neuronal activity in the first context (Ctx A, y axis) and from left to right in the second context (Ctx B, x axis). With a 5h interval between Ctx A and B, the likelihood that neurons with high activity in Ctx A remained with high activity in Ctx B was higher than chance for both WT and Ccr5 KO mice. With a 2d interval, the likelihood that neurons with high activity in Ctx A remained high activity in Ctx B was at chance levels in WT mice. In contrast, Ccr5 KO mice showed a pattern similar to that observed with the 5h interval (WT n=5, Ccr5−/− n=6 mice).
e, Cells were again sorted from high to low activity in Ctx A with a 10% sliding window and 2% steps. The probability of overlap between subsets of cells (10% ensemble size) from Ctx A and the ensemble cells with top 10% high activity in Ctx B was plotted. The probability values were z-scored with respect to a null distribution created by randomly subsampling 10% of cells from Ctx A 10,000 times (i.e., results are represented as standard deviation (SD) from the mean of the null distribution). The 2SD threshold is labeled with a dashed line (WT n=5, Ccr5−/− n=6 mice).
