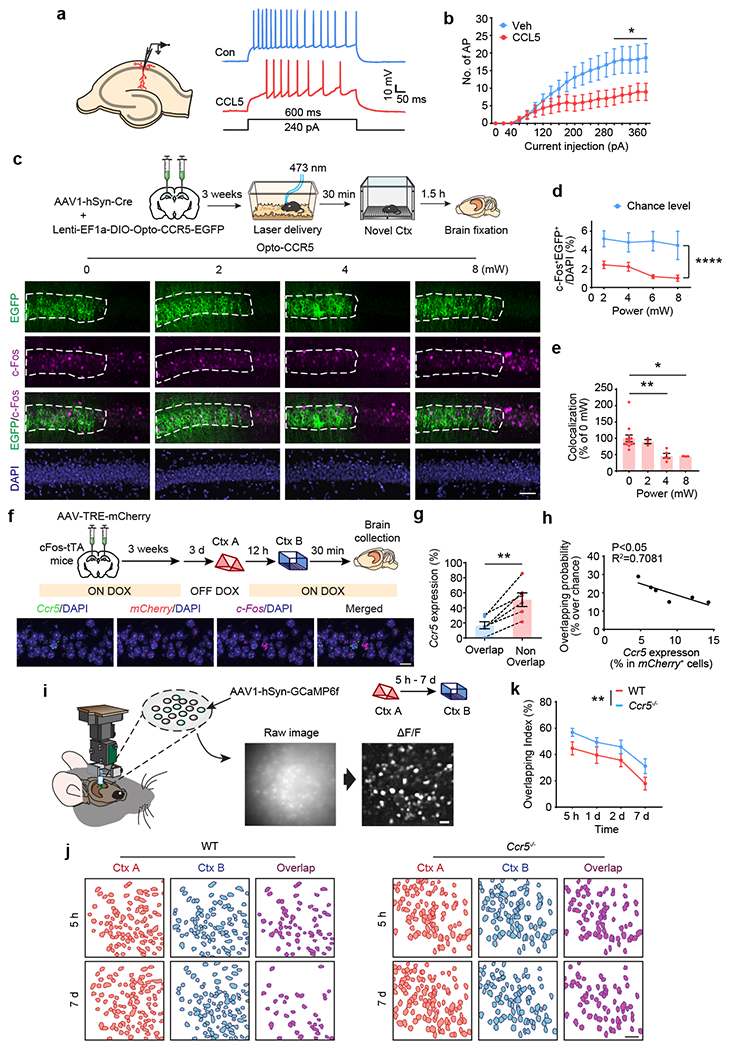
Fig. 3|. CCR5/CCL5 modulate neuronal excitability, memory allocation and the overlap of memory ensembles.

a, Schematics of neuronal recordings and representative traces.
b, dCA1 neurons treated with CCL5 for 1h showed a significant decrease in firing rate (Veh control n=10 cells, CCL5 n=9 cells, *P < 0.05, two-way repeated measures ANOVA).
c, Representative images of colocalization between c-Fos and Opto-CCR5-EGFP after light stimulation and novel context exposure. Scale bar, 50 μm.
d, Percentage of c-Fos+EGFP+ cells at different power levels (0 mW n=13, 2 mW n=3, 4 mW n=5, 8 mW n=3 mice; ****P < 0.0001, two-way repeated measures ANOVA).
e, Colocalization between c-Fos+ cells and EGFP+ cells after normalization to chance level. (0 mW n=13, 2 mW n=3, 4 mW n=5, 8 mW n=3 mice; *P < 0.05, ** P < 0.01, one-way ANOVA).
f, Schematics & representative images of Ccr5 expression and the overlap between memory ensembles of context A (mCherry) and context B (c-Fos) with a 12h interval between the two contextual exposures. Scale bar, 20 μm.
g, The probability of Ccr5 expression in the overlapping cells is lower than that in the non-overlapping cells (n=6 mice; **P < 0.01, paired t-test).
h, Probability of ensemble overlap (between context A and context B) and Ccr5 expression in mCherry+ cells (ensemble for context A) are negatively corelated (n=6 mice; R2=0.7081, P < 0.05).
i, Schematics for miniscope setup and calcium signal identification. Images were collected from mice exploring different contexts separated by either 5h, 1d, 2d, or 7d. Scale bar, 50 μm.
j, Neuronal overlap between different contexts. Scale bar, 50 μm.
k, Overlapping index for WT and Ccr5−/− mice (WT 5 h–7 d n = 7 mice; Ccr5 5 h n = 7, 1 d–7 d n = 6 mice; **P < 0.01, two-way ANOVA).
All results shown as mean ± s.e.m.
