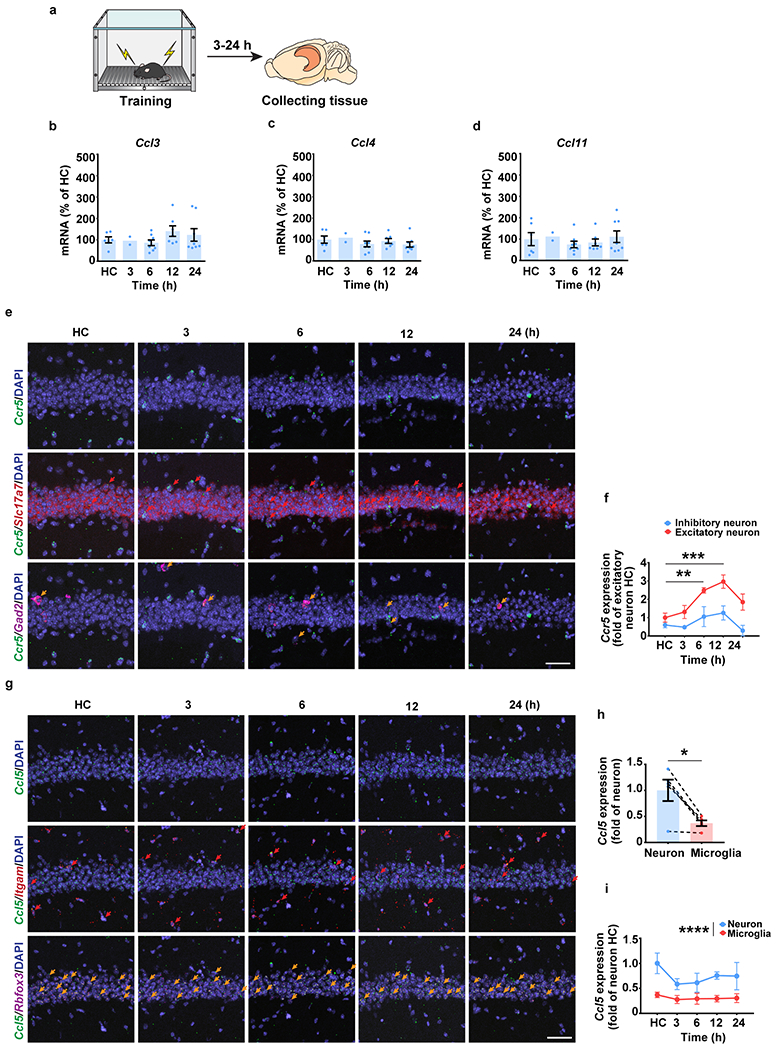
Extended Data Fig. 1|. Dorsal hippocampal expression of CCR5 and its ligands after fear conditioning.

a, Schematics of hippocampal tissue collection.
b-d, qPCR experiment to measure Ccl3 (b), Ccl4 (c), and Ccl11 (d) expression in naïve mice (HC) and in mice at different times after contextual fear conditioning. HC=home cage. HC n=6, 3 h n=2, 6 h n=8, 12 h n=7, 24 h n=8 mice.
e, Representative images of Ccr5, Slc17a7 (excitatory neuronal marker), and Gad2 (inhibitory neuronal marker) mRNA expression in dCA1 from naïve mice or mice 3-24h after fear conditioning. Red arrows: cells expressing Ccr5 and Slc17a7. Orange arrows: cells expressing Ccr5 and Gad2. Scale bar, 50 μm.
f, Number of Ccr5-expressing excitatory and inhibitory neurons 3-24h after fear conditioning (HC n=4, 3 h n=4, 6 h n=4, 12 h n=4, 24 h n=3 mice; **P < 0.01, ***P < 0.001, two-way repeated measures ANOVA).
g, Representative images of Ccl5, Itgam, and Rbfox3 mRNA expression in dCA1 from naïve mice or mice 3-24h after fear conditioning. Red arrows: cells expressing Ccl5 and Itgam. Orange arrows: cells expressing Ccl5 and Rbfox3. Scale bar, 50 μm.
h, Number of Ccl5-expressing microglia and neurons in naïve mice (n=5 mice; *P < 0.05, paired t-test).
i, Number of Ccl5-expressing microglia and neurons in HC mice and 3-24h after fear conditioning (n=5 mice per group; ****P < 0.0001, two-way repeated measures ANOVA).
All results shown as mean ± s.e.m.
