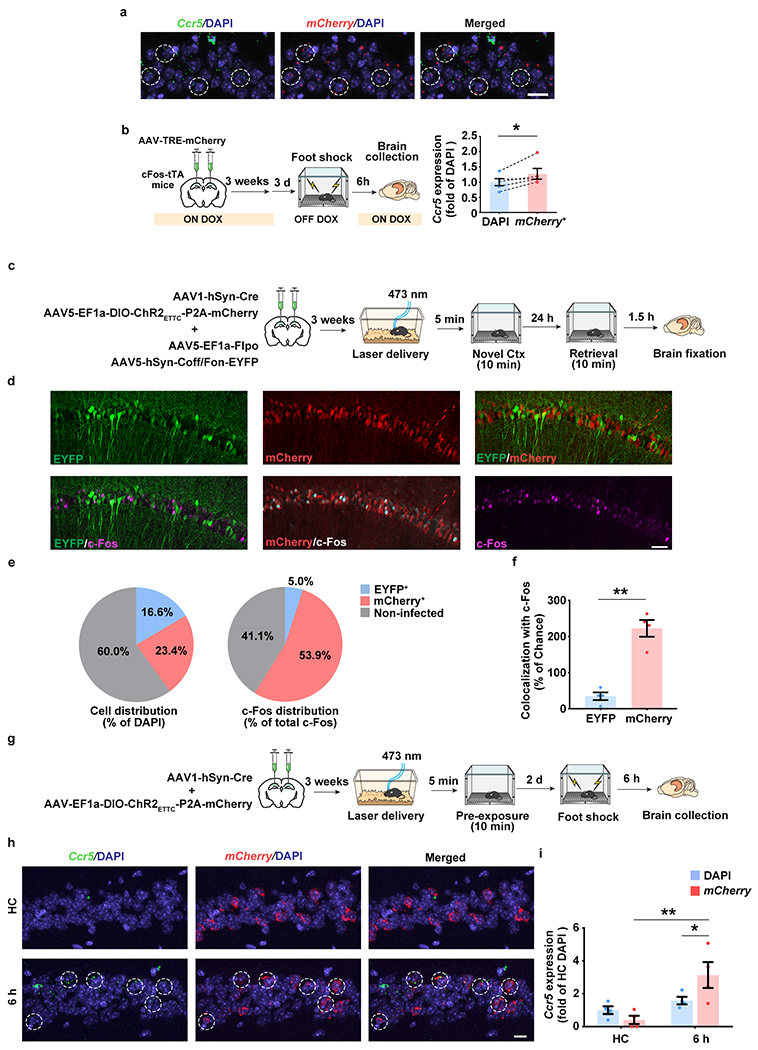
Extended Data Fig. 2|. The co-localization of Ccr5 expression and memory ensembles measured with cFos-tTA mice and the optogenetic (ChR2ETTC) pre-activation system.

a, Representative images of Ccr5 and mCherry (neuronal ensemble) mRNA expression in dCA1 from cFos-tTA mice 6h after fear conditioning. Co-localization was labeled with dashed circles. Scale bar, 20 μm.
b, Quantification of Ccr5 expression in total cells (DAPI) and neuronal ensemble (mCherry+). (n=5 mice; *P < 0.05, paired t-test).
c, Schematics to use blue light to activate ChR2ETTC-expressing neurons to be involved in neuronal ensemble by pre-activation. INTRSECT system (Cre-off/Flp-on) was used to label non-ChR2ETTC-expressing neurons as the control.
d, Representative images of mCherry (pre-activated neurons), c-Fos (neuronal ensembles), and EYFP (non-preactivated neurons) in dCA1 24h after the novel context exposure. Scale bar, 50 μm.
e, c-Fos distribution in mCherry+, EYFP+ or non-infected cells.
f, Quantification of the colocalization between c-Fos and mCherry or EYFP. Colocalization (of c-Fos and mCherry) = (c-Fos+mCherry+/DAPI)/[(c-Fos+/DAPI)*(mCherry+/DAPI)] (n=4 mice per group; **P < 0.01, paired Student’s t-test).
g, Schematics to detect the colocalization of Ccr5 expression in neuronal ensembles using pre-activation system.
h, Representative images of Ccr5 and mCherry (pre-activated neuronal ensemble) mRNA expression in dCA1 6h after fear conditioning. Colocalization was labeled with dashed circles. Scale bar, 20 μm.
i, Quantification of Ccr5 expression in total cells (DAPI) and pre-activated neuronal ensemble (mCherry+) (n=4 mice per group; *P < 0.05, **P < 0.01, two-way repeated measures ANOVA).
All results shown as mean ± s.e.m.
