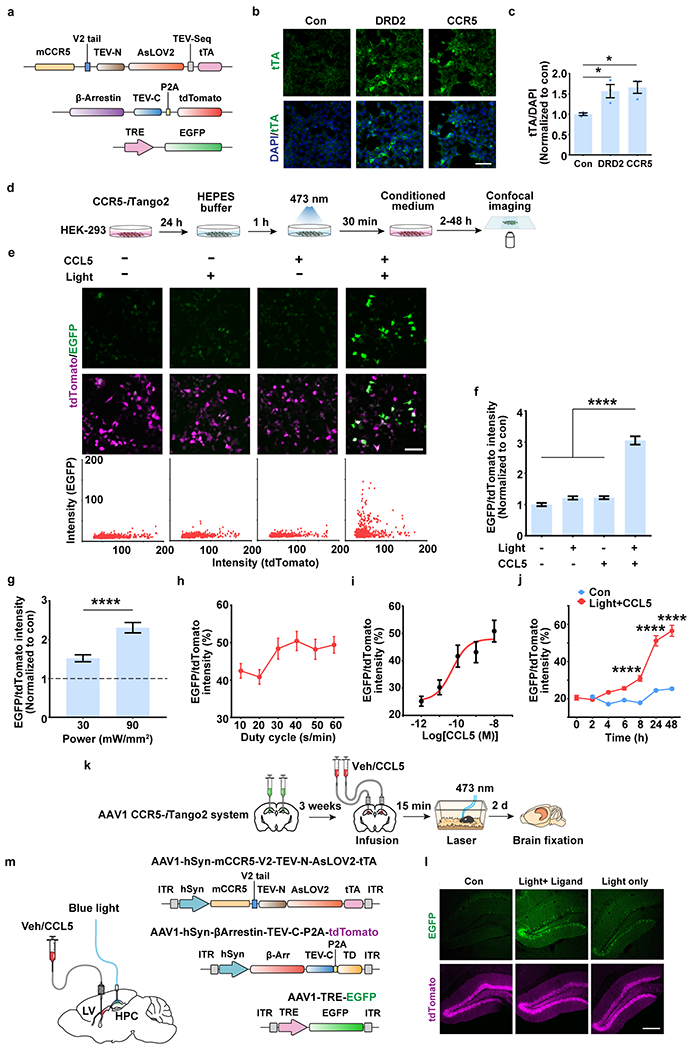
Extended Data Fig. 3|. Characterization of CCR5-iTango2.

a, Schematics of CCR5-iTango2 constructs.
b, c, Expression validation of the CCR5-iTango system in HEK-293 cells. DRD2-iTango2 (for Dopamine 2 receptor) was used as a positive control. b, Representative images of tTA immunostaining. Scale bar, 50 μm. c, Quantification of tTA expression (intensity normalized to DAPI). n=3 slides per group; *P < 0.05, one-way ANOVA.
d, HEK-293 cells were transfected with 3 plasmids (see methods) for 24h and then treated with 10 nM CCL5 and blue light to induce EGFP expression.
e, Representative images of EGFP expression after different treatments. Light−CCL5− n=558, Light+CCL5− n=507, Light−CCL5+ n=521, Light+CCL5+ n= 500 cells. Scale bar, 50 μm.
f, Quantification of EGFP and tdTomato ratio (intensity). Compared to control, light or CCL5 group, only the group with both light and CCL5 showed EGFP expression. Light−CCL5− n=70, Light+CCL5− n=97, Light−CCL5+ n=97, Light+CCL5+ n=282 cells; ****P < 0.0001, one-way ANOVA.
g, Power-dependent EGFP expression. Results were normalized to no light control (30 mW/mm2 n=320, 90 mW/mm2 n=307 cells; ****P < 0.0001, student’s t-test).
h, Duty cycle dependent EGFP expression. The light stimulation was delivered every minute (~0.017 Hz) to induce EGFP expression. Light was kept on for 10-60 s during each stimulation to induce EGFP expression (10 s/min n=407, 20 s/min n=377, 30 s/min n=307, 40 s/min n=383, 50 s/min n=353, 60 s/min n=524 cells).
i, Dose curve of CCL5 to induced CCR5 activation (measured by EGFP/tdTomato fluorescence ratio) in cultured HEK-293 cells (10−12 M n=49, 10−11 M n=39, 10−10 M n=29, 10−9 M n=77, 10−8 M n=86 cells).
j, Time course of EGFP expression. The green fluorescence increased monotonically during the different time intervals investigated. Compared to other time intervals (2, 4, 6, 8 and 24h), the 48h time interval showed the highest EGFP/tdTomato ratio (Light+CCL5+ 0 h n=58, 2 h n=194, 4 h n=282, 6 h n=310, 8 h n=316, 24 h n=396, 48 h n=345 cells; Light−CCL5− 2 h n=195, 4 h n=219, 6 h n=290, 8 h n=304, 24 h n=445, 48 h n=401 cells; ****P < 0.0001, two-way ANOVA).
k, Schematics of CCR5-iTango2 AAVs injected into mouse hippocampus and validated through intra-hippocampal infusion of CCL5 and fiber-optic light stimulation.
l, Representative images of CCR5-iTango2-expressing hippocampal dentate gyrus neurons in control condition (no light and CCL5), light only, and light with CCL5. Ligand and light were directly delivered into the hippocampus. Scale bar, 250 μm.
m, Left: To test CCR5-iTango2 activation in dCA1 (Fig. 1h), CCL5 was infused into the lateral ventricle (LV) while light was delivered into dCA1 of hippocampus (HPC). Right: Schematics of CCR5-iTango2 AAVs.
All results shown as mean ± s.e.m.
