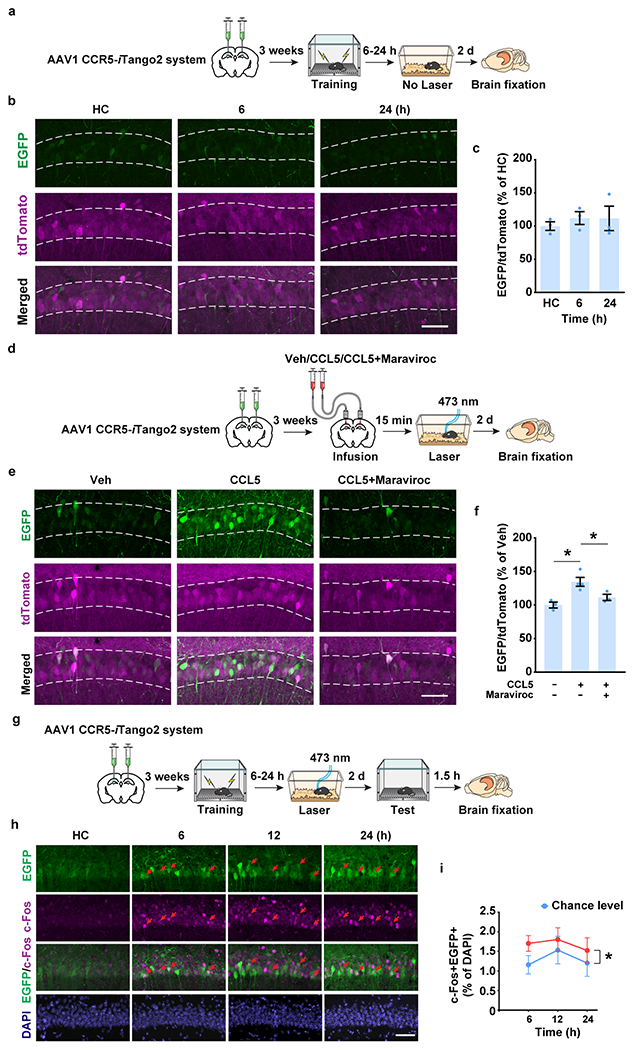
Extended Data Fig. 4|. CCR5 activation measured with the CCR5-iTango2 system in vivo.

a-c, Validation of the leakage in CCR5-iTango2 system in vivo.
a, Schematics to test the CCR5-iTango2 system without light activation.
b, Representative images of EGFP and CCR5-iTango2-expressing dCA1 neurons after fear conditioning. Scale bar, 50 μm.
c, Quantification of EGFP expression (intensity normalized to tdTomato, n=3 mice per group).
d-f, Validation of the maraviroc mediated CCR5 inhibition in vivo.
d, Maraviroc was co-infused with CCL5 into mouse dCA1. The CCR5-iTango2 was used to measure CCR5 activation in vivo.
e, Representative images of CCR5-iTango2-expressing dCA1 neurons after fear conditioning. Scale bar, 50 μm.
f, Quantification of EGFP expression in different treatment (CCL5−Maraviroc− n=3, CCL5+Maraviroc− n=4, CCL5+Maraviroc+ n=3 mice; *P < 0.05, one-way ANOVA).
g-i, Analyses of colocalization of c-Fos and CCR5 activation in vivo.
g, Schematics to test c-Fos expression in EGFP+ cells after learning with the CCR5-iTango2 system.
h, Representative images of colocalization between EGFP and c-Fos in dCA1. Red arrows: c-Fos+EGFP+ cells. Scale bar, 50 μm.
i, Percentage of c-Fos+EGFP+ cells in total cells (6 h n=6, 12 h n=4, 24 h n=5 mice; *P < 0.05, two-way repeated measures ANOVA).
All results shown as mean ± s.e.m.
