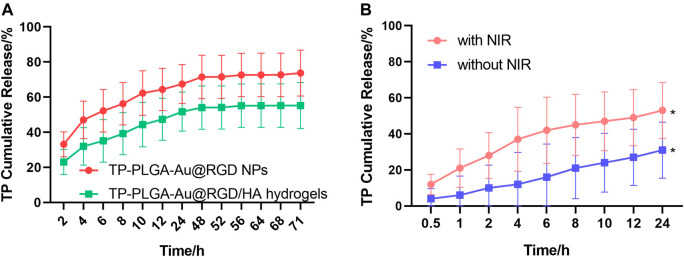
FIGURE 5.
(A) Profiles of TP release from TP-PLGA-Au@RGD/HA hydrogels and TP-PLGA-Au@RGD NPs under initial NIR irradiation for 10 min. (B) Profiles of TP release from TP-PLGA-Au@RGD/HA hydrogels with or without NIR irradiation for 10 min. Data are expressed as mean values for n = 3, and error bars represent the standard deviation of the means (*p < 0.05).

