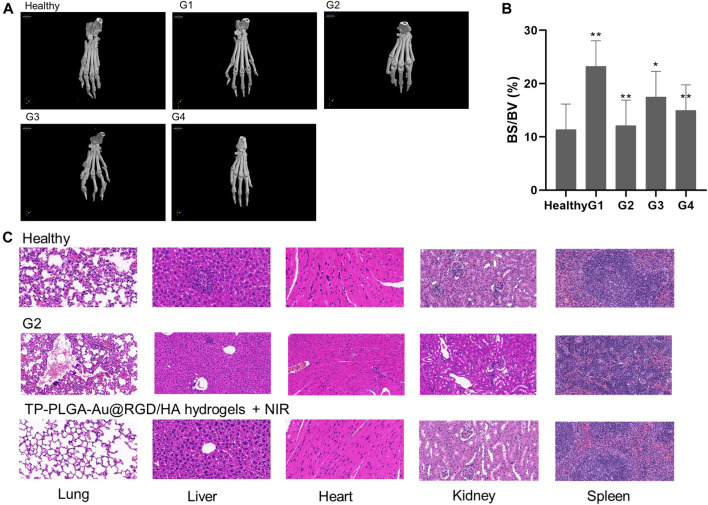
FIGURE 9.
(A) Micro-computed tomography images of hind paws of CIA mice in different treatment groups. (B) Effects of G4 on bone destruction in CIA mice. Bone volume/total volume (BV/TV; %) in CIA mice. *p < 0.05 versus G1; **p < 0.01 versus G1. (C) Histological sections of major organs extracted on day 28 after administration of health (top), TP-PLGA-Au@RGD/HA hydrogels combined with NIR irradiation (bottom, G4) and G2. Images were acquired under ×20 magnification.

