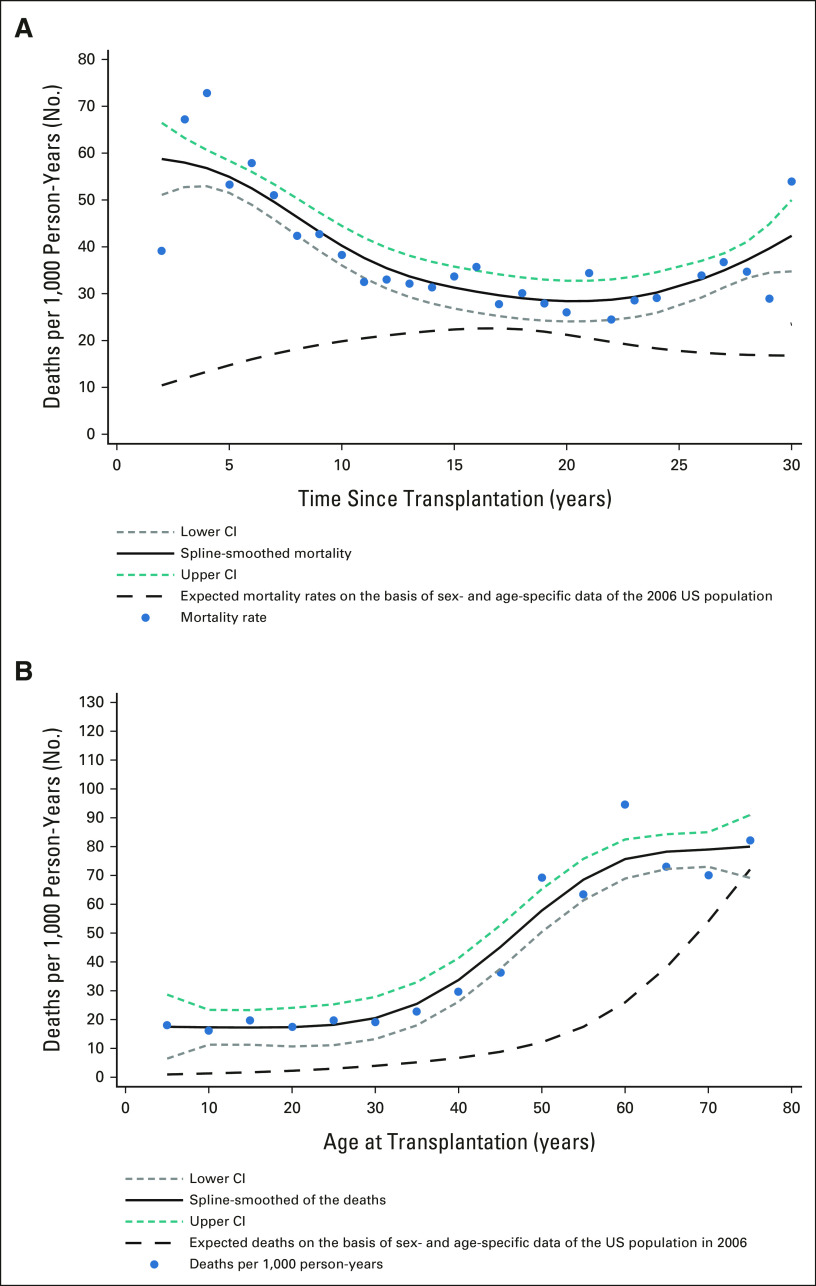
FIG 1.
(A) Mortality rate as a function of time from BMT in a cohort of autologous BMT recipients surviving 2 or more years after transplantation. Empirical mortality rates during each year (solid circles) are shown with fitted rates from the spline-smoothed Poisson regression model (solid line) and associated pointwise 95% CIs (short-dashed lines), and the expected mortality rates for each interval on the basis of sex- and age-specific data for the US population in 2006 (long-dashed line). (B) Mortality rate as a function of age at BMT in a cohort of autologous BMT recipients surviving 2 or more years after transplantation. Empirical annual mortality rates during each 5-year interval of age, plotted at the midpoint of each interval (blue circles), fitted rates from the spline-smoothed Poisson regression model (solid line) and associated pointwise 95% CIs (short-dashed lines), and the expected mortality rates for each interval on the basis of an average of sex-specific US population rates at each age in 2006 (long-dashed lines). BMT, blood or marrow transplantation.

