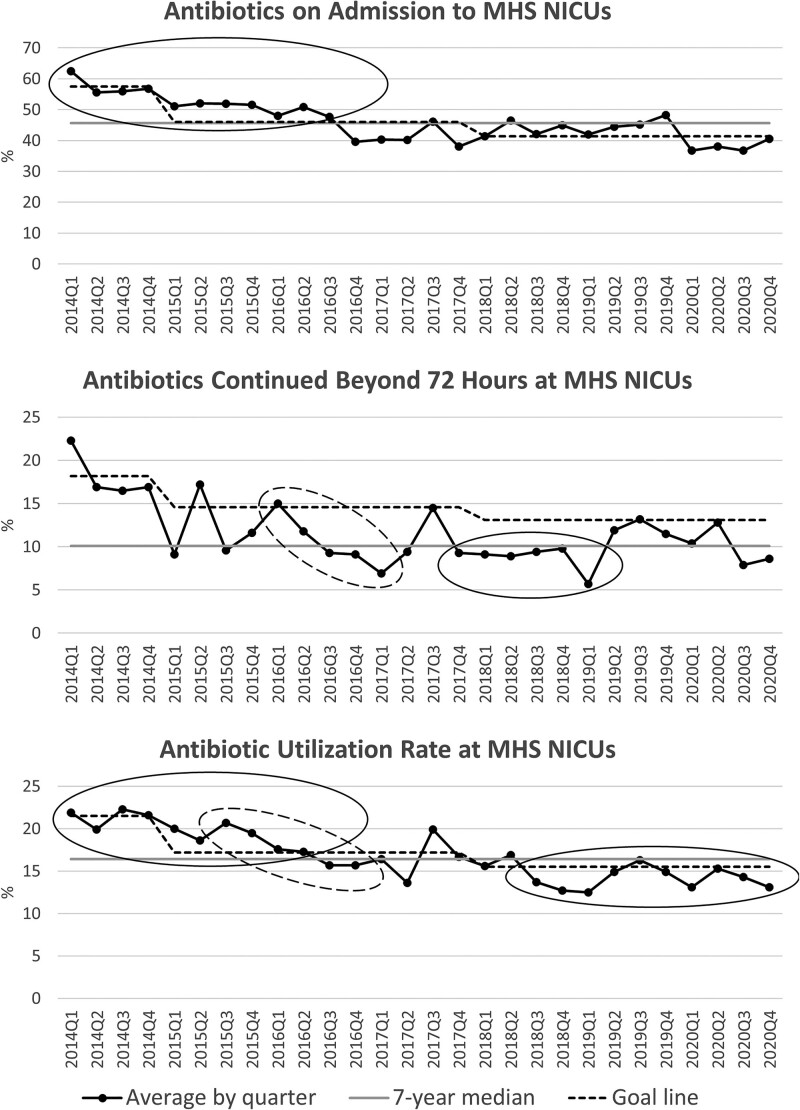
Fig. 3.
Antibiotic stewardship run charts. Goal-line set as baseline period mean for first 4 quarters (2014), 20% reduction from baseline period for subsequent 3 years (2015−2017), and an additional 10% reduction for final 3 years (2018−2020). Seven-year median based on all years of the project, including baseline period. Solid and dashed ovals represent shifts (at least 6 points above or below the median) and trends (at least 5 points in the same direction). Run charts show improvements in both shifts and trends for all 3 metrics throughout the 7-year project. MHS, Memorial Healthcare System; NICUs, neonatal intensive care units.

