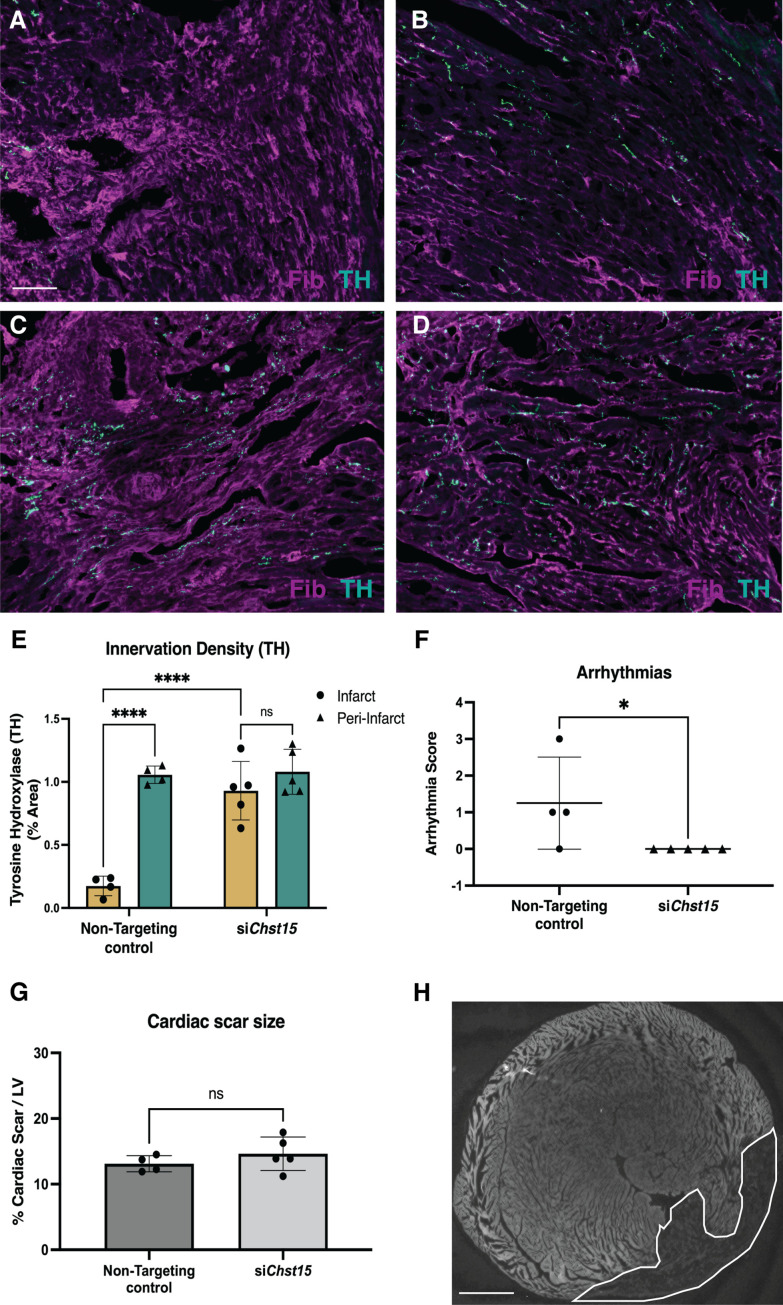
Figure 7. Reducing 4,6-tandem sulfation of CS-GAGs in vivo promotes sympathetic nerve regeneration into the cardiac scar.
Fibrinogen was used to label scar (magenta) and Tyrosine Hydroxylase (TH) was used to label sympathetic neurons (cyan). Example image of (A) denervated infarct in non-targeting control-treated animal versus (B) normal density of TH + fibers in the peri-infarct region adjacent to the scar. Systemic delivery of silencing RNA (siRNA) against Chst15 post-MI restored TH + fibers in the cardiac infarct (C) without altering nerve density outside the infarct (D). Scale bar, 100 μm. (E) Quantification of TH innervation density 10 days after MI. n=4 animals for non-targeting controls and n=5 for Chst15 siRNA-treated animals. Data are mean percent TH ± SD. Two-way ANOVA, Tukey’s post-test to compare all groups, select comparisons shown; siChst15 infarct vs. peri-nfarct ns – not significant p-value = 0.668, non-targeting infarct vs. peri-nfarct ****p-value < 0.0001, non-targeting infarct vs. siChst15 infarct ****p-value < 0.0001. (F) Arrhythmia scores based on the most severe arrhythmia observed in each heart after injection of isoproterenol and caffeine (0=no PVCs, 1=single PVCs, 2=bigeminy or salvos, 3=non-sustained ventricular tachycardia). See Materials and methods for details. Treatment with siRNA against Chst15 reduced arrhythmias compared to non-targeting controls. n=4 animals for non-targeting controls and n=5 animals for Chst15 siRNA. Data are arrhythmia score for each animal. Statistics: Student’s t-test (Mann-Whitney test), *p<0.047. (G) Cardiac scar size assessed as a percent area of total left ventricle (LV) area was unaltered in Chst15 siRNA-treated animals compared to non-targeting controls. Quantification of n=4 animals for non-targeting controls and n=5 for Chst15 siRNA-treated animals. Data are mean percent area scar ± SD. Statistics: Student’s t-test (Welch’s test), ns – not significant p-value = 0.283. (H) Example 2× image of cardiac scar in Chst15 siRNA-treated heart using autofluorescence, absence of autofluorescence indicates region of the infarct, outlined in white. Scale bar, 500 μm.

