. 2022 Jun 1;11:e77030. doi: 10.7554/eLife.77030

Figure 1. State-dependent modification of KCNQ2-R198C by external methanethiosulfonate (MTSET) is consistent with outward S4 motion.

(A) Cartoons showing cysteine accessibility method with MTSET and two-electrode voltage clamp setup. (B) Sequence alignment of homologous S4 residues in KCNQ2, KCNQ3, KCNQ1, and Shaker channels. (C, E, and G) Currents from oocytes expressing (C) KCNQ2-N190C, (E) R198C, and (G) F202C channels in response to 20 mV voltage steps from –140 mV to +40 mV (left panels) before and after applications of MTSET (after washout, gray) in the closed and (after washout, color-coded) open states. MTSET is first applied (‘closed state’-middle panels) at –80 mV for 5 s in between 25 s washouts for 8–15 cycles and the change in current is measured at +20 mV. On the same cell and after MTSET is washed out of the bath, MTSET is reapplied (‘open state’-middle panels) at +20 mV using a similar protocol. We used 100 μM MTSET in (C) and (G), and 50 μM MTSET in (E). (D, F, and H) Steady-state conductance/voltage relationships, G(V)s, (lines from a Boltzmann fit) of (D) KCNQ2-N190C, (F) R198C, and (H) F202C channels normalized to peak conductance before MTSET application (black). The G(V) relationships after MTSET application in the closed (–80 mV, gray) and open (+20 mV, color-coded) states are obtained from recordings of panels (C), (E), and (G), (‘closed- and open state’-middle panels, respectively); mean ± SEM, n=3–24. (I) The rate of MTSET modification of R198C channels at +20 mV (red squares) or –80 mV (gray squares) was measured using the difference in current amplitudes taken at 400 ms after the start of the +20 mV voltage step, vertical dashed arrows in (E) between the first sweep (before MTSET application, which is represented by #0 along the vertical dashed arrows in (E) and normalized to zero) and the subsequent sweeps (after several MTSET application which are represented by #1, 2, …8–9 along the vertical dashed arrows in (E)) from the ‘closed-state and open-state’-middle panels. The normalized delta current amplitude was plotted versus the cumulative MTSET exposure and fitted with an exponential. The fitted second-order rate constant in the open state protocol is shown in red. kopen = 3230 ± 3.8 M–1 s–1 (n=8). (J) Cartoon representing the voltage-dependent cysteine accessibility data. MTSET modifies N190 in both the closed and open states. While F202 remains unmodified in both states (seemingly buried in the membrane), R198 becomes accessible only in the open state. Dashed line indicates the proposed outer lipid bilayer boundary.

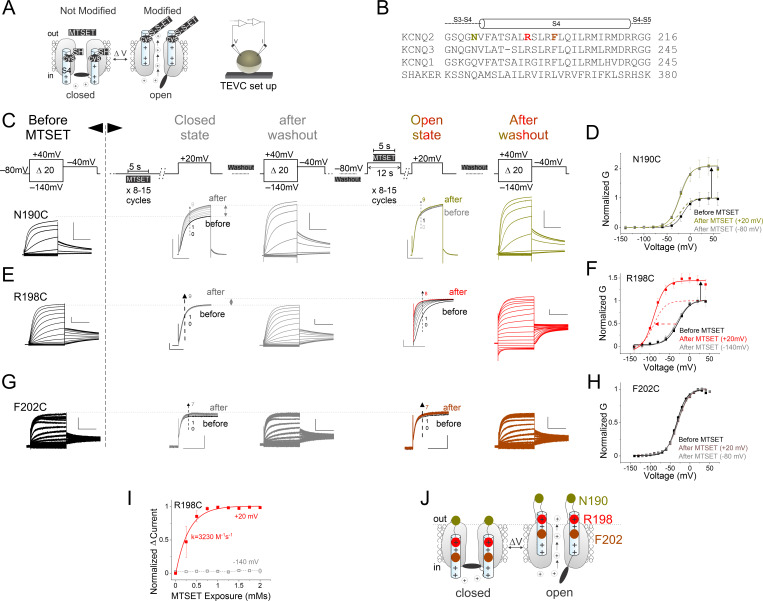
Figure 1.

Figure 1—figure supplement 1. State-dependent modification of S4 residues by external methanethiosulfonate (MTSET) consistent with outward S4 motion.

Figure 1—figure supplement 1.

(A, C, D, E, F, and G) Currents from oocytes expressing (A) wild type (wt), (C) A193C, (D) S195C, (E) A196C, (F) S199C, and (G) L200C channels in response to 20 mV voltage steps from –140 mV to +40 mV (left) before and after applications of MTSET (middle) at hyperpolarized voltages (–80 mV for S195C and A196C, –100 mV for S199C and L200C, and –120 mV for A193C) and (right) a depolarized voltage at +20 mV. We repeat 5 s MTSET application in between 25 s washouts for 8–15 cycles, as shown in the open and closed protocols in Figure 1C. We used MTSET concentrations ranging from 10 to 100 μM, respectively. (B) Summary of G(V)1/2 values for the wt and cysteine mutants before MTSET application. Insets represent exemplar current traces of MTSET modification measured at +20 mV in both the (middle) closed and (right) open states. Scale bars: 1 s, 1μA. (A’, C’, D’, E’, F’, and G’) Normalized G(V) relations (lines from a Boltzmann fit) of recordings from panels (A), (C), (D), (E), (F), and (G), respectively, before (black) and after MTSET application in the (gray) closed and (color-coded) open states. The G(V)s after MTSET modification of recordings from panels (A), (C), (D), (E), (F), and (G) were normalized to peak conductance before MTSET application (black). mean ± SEM, n=3–21. Summary of (C’’, D’’, E’’, F’’, and G’’) relative change in current amplitude at +40 mV and (C’’’, D’’’, E’’’, F’’’, and G’’’) voltage dependence shift of MTSET-mediated modification of the cysteine mutants in (gray) the closed and (color-coded) open states. Mean ± SEM, n=3–15. Due to the non-saturating G(V) at negative voltages in A193C, S195C, and A196C after MTSET application in the open state, we used the voltages at the midpoint of the measured G(V) curves to calculate the estimated minimum shifts in voltage dependences in (C’’’, D’’’, E’’’), respectively. Statistical significance was determined using the paired Student’s t-test and significance level was set at p<0.05. Asterisks denote significance: p<0.05*, p<0.01**, p<0.001***. (H) Cartoon representing the voltage-dependent cysteine accessibility data from all residues assayed. Unlike residue N190 (yellow) that is modified by MTSET in both closed and open states (always exposed), residue F202 (brown) remains unmodified in both closed and open states (buried in the membrane). A stretch of eight to nine amino acids (193 to 200–201) moves from a membrane-buried position in the closed state to the extracellular solution during channel opening. Note that because R201C produces voltage-independent channels, we cannot test the state-dependent modification of MTS reagents. The dashed line indicates the proposed outer lipid bilayer boundary. Only two subunits of the tetrameric channel are shown.
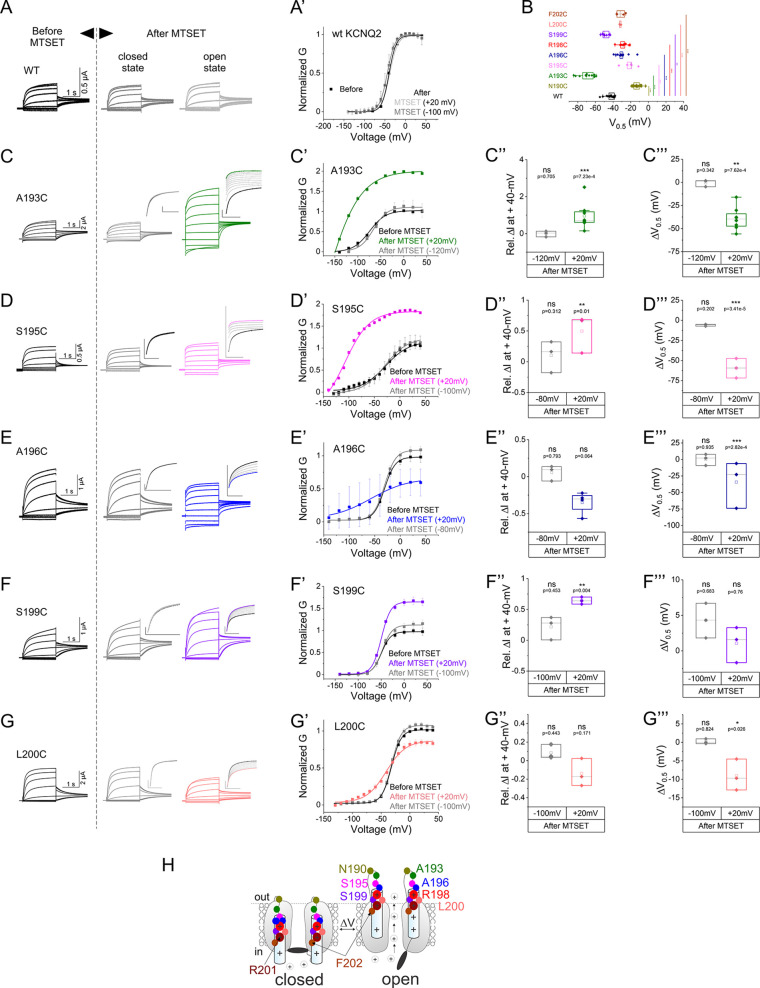
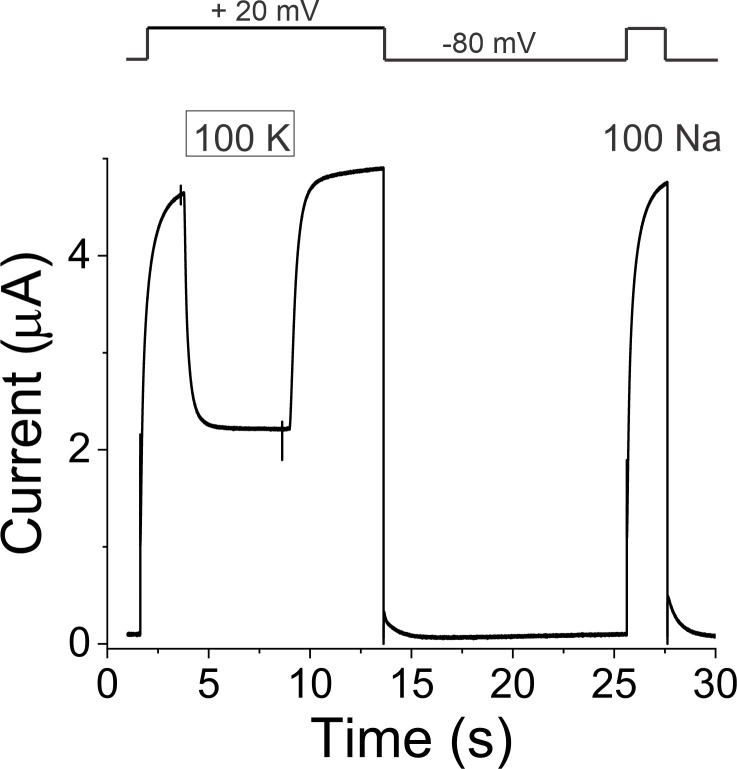
Figure 1—figure supplement 2. Fast perfusion system delivers 5 s applications of external solution exchange to whole oocytes.

Figure 1—figure supplement 2.

Representative time course of solution exchange from 100 mM NaCl (Na) to 100 mM KCl (K). Currents from KCNQ2 channels in response to a +20 mV pulse from a holding potential of –80 mV followed by a tail potential of –80 mV. Extracellular solution was ND96 (100 mM NaCl) except for the 5 s application for which the 100 mM NaCl was exchanged for 100 mM KCl. Shown are three cycles of solution exchanging as shown in the protocol (top). The application of 100 mM KCl quickly reduces (τ=0.21 ± 3.6 s) the outward currents, and the reintroduction of the 100 mM NaCl quickly (τ=0.32 ± 1.5 s) restores the currents.
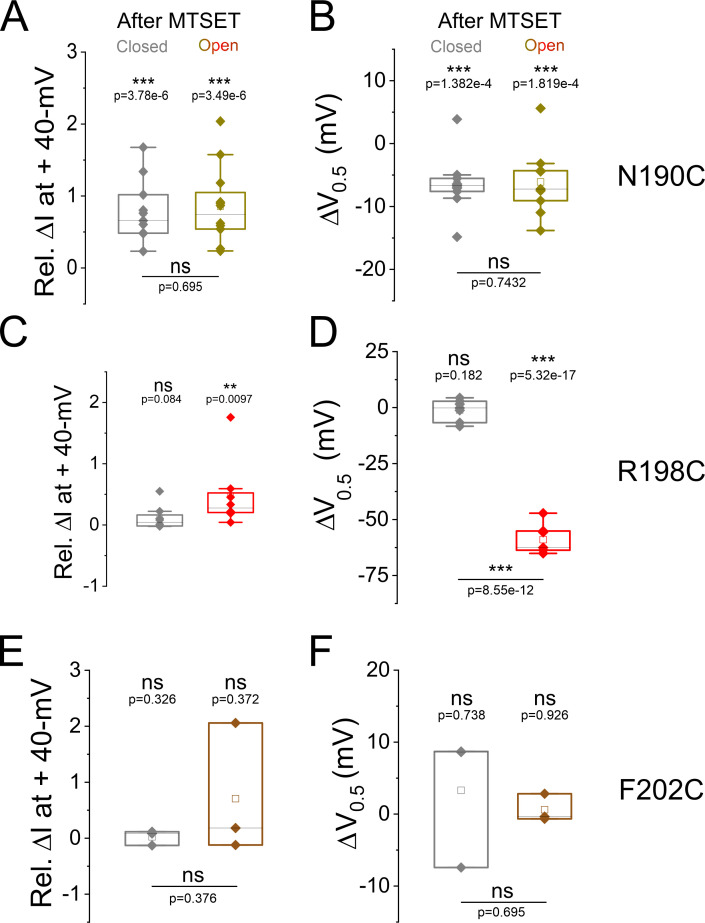
Figure 1—figure supplement 3. Summary of modification of N190C, R198C, and F202C in the closed and open states by external methanethiosulfonate (MTSET).

Figure 1—figure supplement 3.

Summary of (A, C, and E) relative change in current amplitude at +40 mV and (B, D, and F) voltage of half activation shift of MTSET-mediated modification of the cysteine mutants in (gray) the closed and (color-coded) open states. Mean ± SEM, n=3–24. Statistical significance was determined using the paired Student’s t-test and significance level was set at p<0.05. Asterisks denote significance: p<0.01**, p<0.001***.
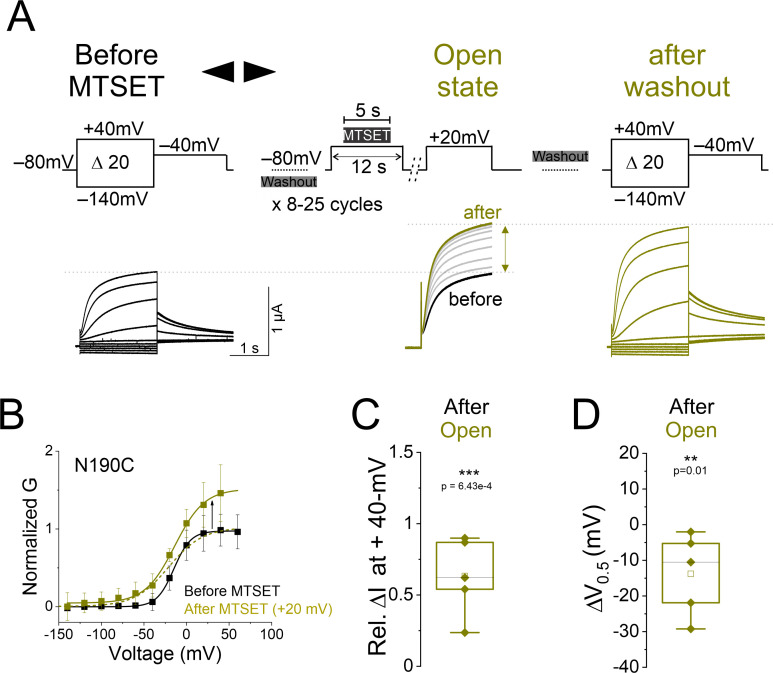
Figure 1—figure supplement 4. Modification of N190C in the open state by external methanethiosulfonate (MTSET).

Figure 1—figure supplement 4.

(A) Currents from oocytes expressing KCNQ2-N190C channels in response to 20 mV voltage steps from –140 mV to +40 mV (black) before and (yellow) after application of MTSET in the open state. The middle panel in (A) shows currents in response to a +20 mV voltage step during MTSET application on N190C channels in the open state for the indicated voltage protocol. MTSET is applied at +20 mV for 5 s in between 25 s washouts for 8–15 cycles, and the change in current is measured at +20 mV. (B) Steady-state conductance/voltage relationships, G(V), (lines from a Boltzmann fit) of N190C channels normalized to peak conductance before MTSET application (black). The G(V) relationships of N190C channels before and after MTSET application in the open state (+20 mV, yellow) are obtained from recordings of (A, left and right panels, respectively). Summary of (C) relative change in current amplitude and (D) voltage dependence shift of MTSET-mediated modification of N190C channels in the open state. Mean ± SEM, n=5–24. Statistical significance was determined using the paired Student’s t-test (from before) and significance level was set at p<0.05. Asterisks denote significance: p<0.01**.
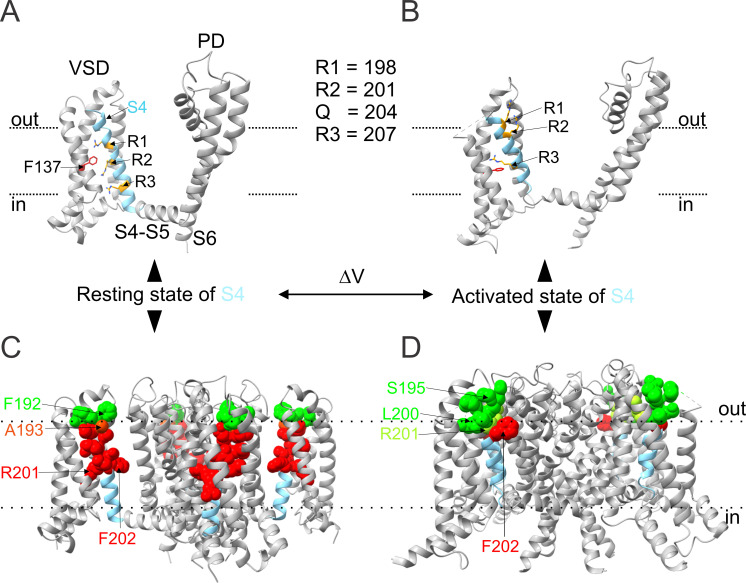
Figure 1—figure supplement 5. Proposed molecular motions of S4 residues in KCNQ2 channels.

Figure 1—figure supplement 5.

(A and C) KCNQ2 homology model in the closed resting state (S4 down) and (B and D) cryo-EM structure of KCNQ2 channel in the activated state of S4 (up) and closed pore. The homology model of KCNQ2 channels with S4 in the resting (down) state was created using the Swiss-model program (https://swissmodel.expasy.org/) with the model of KCNQ1 in the resting state (Kuenze et al., 2019), as template. The homology model of KCNQ2 channels with S4 in the activated (up) state (Li et al., 2021b): PDB code for KCNQ2: 7CR0. (A) In the resting state, R1 and R2 in S4 (cyan) localize above and below the gating charge transfer center F137 (red stick), respectively. (B) Upon S4 activation, R1 and R2 move about three helical turns outward from F137 into a position close to or within the extracellular space. One subunit is shown as ribbons and key amino acid residues as sticks. (C–D) Proposed molecular motions of S4 residues from (C) resting to (D) activated states from cysteine accessibility data. A buried (red spheres) stretch of eight to nine amino acids (193 to 200–201) in the resting state (C) becomes exposed to the extracellular space (green spheres) in the activated state (D). The four subunits are shown as ribbons and buried and extracellularly exposed residues in the S4 are shown as red and green spheres, respectively. Dotted lines indicate the proposed inner and outer lipid bilayer boundary. All images were generated using UCSF ChimeraX, version 1.1 (2020-10-07). VSD: voltage sensing domain; PD: pore domain.