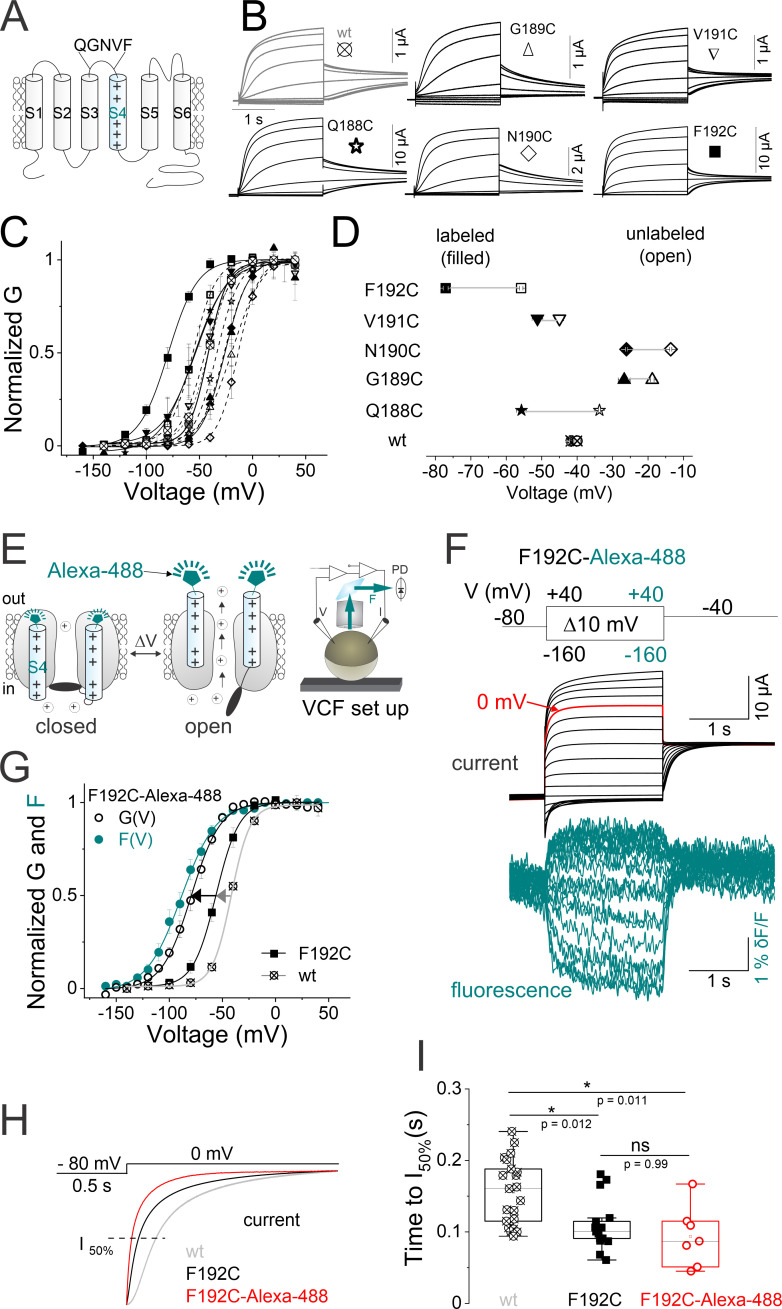
Figure 2. Labeled KCNQ2-F192C channels track S4 movement.
(A) Cartoon showing the topology of one KCNQ2 subunit and the residues in the S3–S4 linker that were sequentially mutated to cysteine. (B) Currents from oocytes expressing a series of cysteine mutants in the S3–S4 linker of KCNQ2 channel. Cells are held at –80 mV and stepped to potentials between −140 mV and +40 mV in 20 mV steps for 2 s followed by a tail to –40 mV. (C) Normalized G(V) (lines from a Boltzmann fit) curves from (open symbols) unlabeled and (filled symbols) Alexa-488-maleimide labeled wt and cysteine mutations shown in (B). The midpoints of activation for the fits are shown in Supplementary file 1. Data are mean ± SEM, n=5–24; see Materials and methods. (D) Summary of G(V)1/2 values for the wt and cysteine mutants (open symbols) before and (filled symbols) after Alexa-488-maleimide labeling. (E) Cartoon representing the voltage clamp fluorometry (VCF) technique. A cysteine is introduced at position 192 (close to the voltage sensor [S4]) and labeled with a fluorophore tethered to a maleimide group (Alexa-488–5 maleimide). Upon voltage changes, labeled-S4s move and the environment around the tethered fluorophore changes, altering fluorescence intensity. Both current and fluorescence are recorded simultaneously using a VCF set up. (F) Representative current (black) and fluorescence (cyan) traces from Alexa-488-labeled KCNQ2-F192C channels (KCNQ2*) for the indicated voltage protocol (top). A sweep to 0 mV is depicted in red to facilitate comparison of time courses in (H–I). (G) Normalized G(V) (black solid lines from Boltzmann fit) and F(V) (cyan circles and cyan solid line from a Boltzmann fit) curves from (black circles) F192C-Alexa-488 ‘KCNQ2*’, (black squares) unlabeled F192C, and (gray squares) wt channels. The midpoints of activation for the fits are: GV1/2F192C-Alexa-488 = –77.1 ± 2.7 mV, (n=9), FV1/2F192C-Alexa-488 = –87.1 ± 3.9 mV, (n=8), GV1/2 unlabeled-F192C = –55.8 ± 0.8 mV, (n=9), and GV1/2wt = –43 ± 0.7 mV, (n=21), Supplementary file 1. Data are mean ± SEM; see Materials and methods. (H) Representative current time courses of (gray) wt, (black) F192C, and (red) F192C-Alexa-488 channels in response to the protocol shown on top. The dashed line represents 50% of the maximum current level at the end of the depolarizing pulse. (I) The time courses of current activations are quantified as the time to reach half the maximum current level at the end of the depolarizing pulse in (H, dashed line). Data are presented as mean ± SEM, n=9–21. Statistical significance was determined using ANOVA and Tukey’s post hoc test, and significance level was set at p<0.05. Asterisks denote significance: p<0.05*. V: voltage; PD in this cartoon represents: photodiode photodetector.


