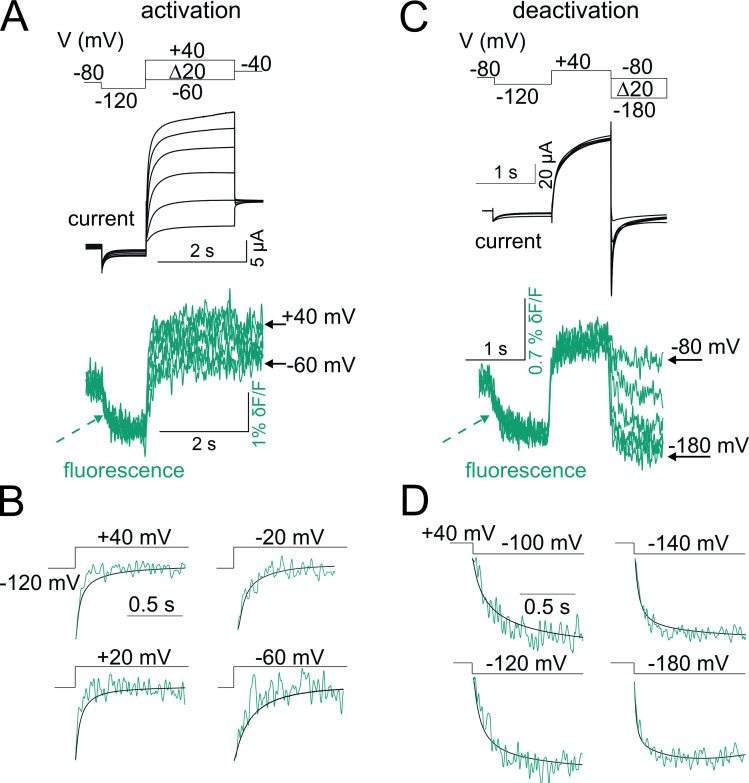
Figure 3. Fluorescence from KCNQ2* correlates with channel opening.
(A–D) Representative current (black) and fluorescence (cyan) traces from KCNQ2* channels for the activation (A) and deactivation (C) voltage protocols (top). In response to the prepulse to −120 mV, the fluorescence signal decreases (cyan dashed arrow), indicating that not all voltage sensors were in their resting position at the holding potential (−80 mV). Representative experiments showing time courses of (B) activation and (D) deactivation of current (black) and fluorescence (cyan) signals from KCNQ2* channels at different voltages as in (A) and (C), respectively. Note that the current and the fluorescence signals correlate during both channel activation and deactivation.

