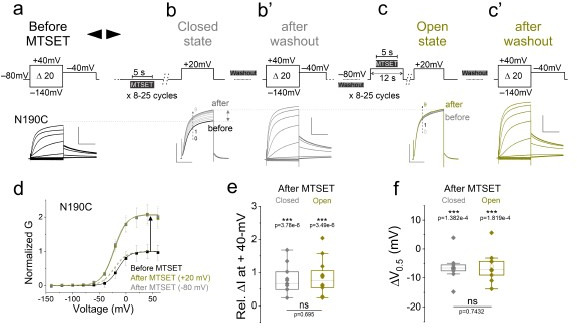
Author response image 2. (a, b’, and c’) Currents from oocytes expressing KCNQ2-N190C channels in response to 20-mV voltage steps from – 140-mV to + 40-mV (a) before and after application of MTSET in the (b’) closed and (c’) open states.

(b and c) currents in response to a + 20-mV voltage step during MTSET application on N190C channels in the (b) closed and (c) open states for the indicated voltage protocols. MTSET is first applied at (b) – 80 mV for 5-s in between 25-s washouts for 8-15 cycles and the change in current is measured at + 20-mV. On the same cell and after MTSET is washed out of the bath, MTSET is re-applied at (c) + 20-mV using a similar protocol as in (b). (d) Normalized steady-state conductance/voltage relationships, G(V), (lines from a Boltzmann fit) of N190C channels normalized to peak conductance before MTSET application (black). The G(V) relationships of N190C channels before and after MTSET application in the closed (-80-mV, gray) and open (+ 20-mV, yellow) states are obtained from recordings of panels (a), (b’), and (c’), respectively. Summary of (e) relative change in current amplitude and (f) voltage dependence shift of MTSET-mediated modification of N190C channels in the (gray) closed and (yellow) open states. Mean ± SEM, n=9-24. Statistical significance was determined using the Student’s t-test and significance level was set at P < 0.05. Asterisks denote significance: p < 0.001***.
