
FIGURE 3.
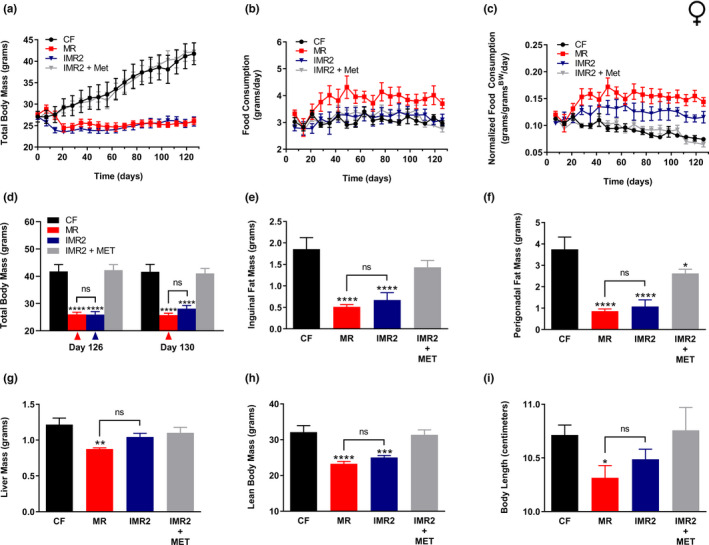
IMR protects female mice against diet‐induced obesity and produces similar healthspan benefits to continuous MR. Comparisons over time of average values for (a) total body mass, (b) food consumption, and (c) food consumption normalized to total body mass for control‐fed (CF; black circles) and continuously methionine‐restricted (MR; red squares) female mice, as well as animals subjected to stringent IMR (IMR2; blue triangles) or animals fed similarly to IMR2 animals but provided methionine in their drinking water (IMR2 + MET; gray triangles). Food consumption graphs (b‐c) show values integrated over 7 days of feeding; expanded graphs are presented in Figure S4. Average values at conclusion of the experiment (~18 weeks) are also shown for (d) total body mass, (e) mass of inguinal fat pads, (f) mass of perigonadal fat pads, (g) liver mass, (h) lean body mass, and (i) body length. For panel d, the colored triangles denote that weighing of the indicated groups occurred following a period of MR. For all panels, bars denote SEM. For panels d‐i, statistically significant differences (as compared with CF values) are indicated (*p < 0.05; **p < 0.01; ***p < 0.001; ****p < 0.0001). No statistically significant differences between MR and IMR2 values were observed (ns). N = 8 for all groups