
FIGURE 6.
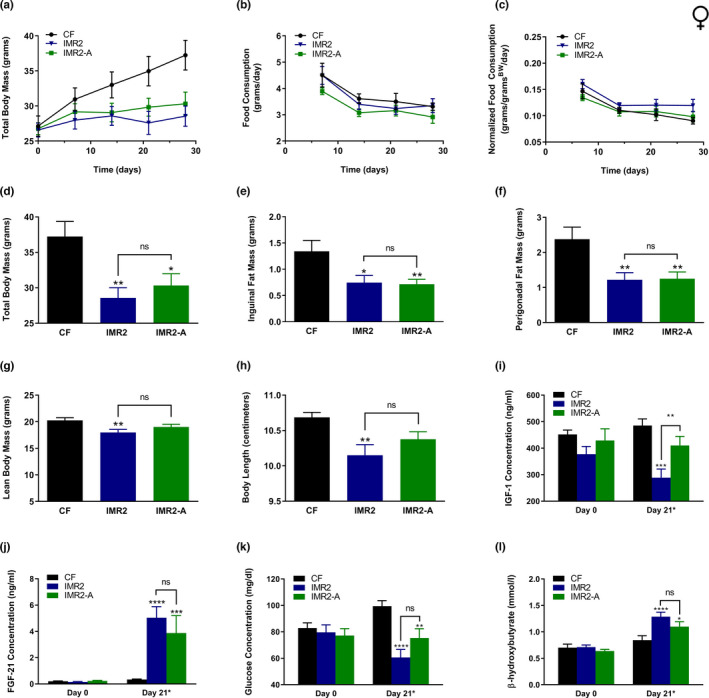
Contiguous‐day IMR and alternate‐day IMR confer similar protection against diet‐induced obesity and similar beneficial plasma hormone and glycemic changes. Comparisons over time of average values for (a) total body mass, (b) food consumption, and (c) food consumption normalized to total body mass for control‐fed female mice (CF; black circles), as well as animals subjected to stringent IMR (IMR2; blue triangles) or fed a modified IMR2 regimen featuring alternating days of methionine restriction and repletion (IMR2‐A; green squares). Food consumption graphs (b‐c) show values integrated over 7 days of feeding; expanded graphs are presented in Figure S6. Average values at conclusion of the experiment (4 weeks) are also shown for (d) total body mass, (e) mass of inguinal fat pads, (f) mass of perigonadal fat pads, (g) lean body mass, and (h) body length. Longitudinal comparisons of the plasma concentrations of (i) IGF‐1 and (j) FGF‐21 were also performed, as well as determination of the blood concentrations of (k) glucose and (l) β‐hydroxybutyrate; control‐fed mice and animals subjected to IMR2 were sampled at baseline and on Day 21, whereas animals undergoing the IMR2‐A regimen were sampled at baseline and on Day 19 (Day 21*). For all panels, bars denote SEM. For panels d‐l, statistically significant differences (as compared with CF values) are indicated (*p < 0.05; **p < 0.01; ***p < 0.001; ****p < 0.0001); statistically significant differences between IMR2 and IMR2‐A values are either indicated (**p < 0.01) or absent (ns). N = 8 for all groups