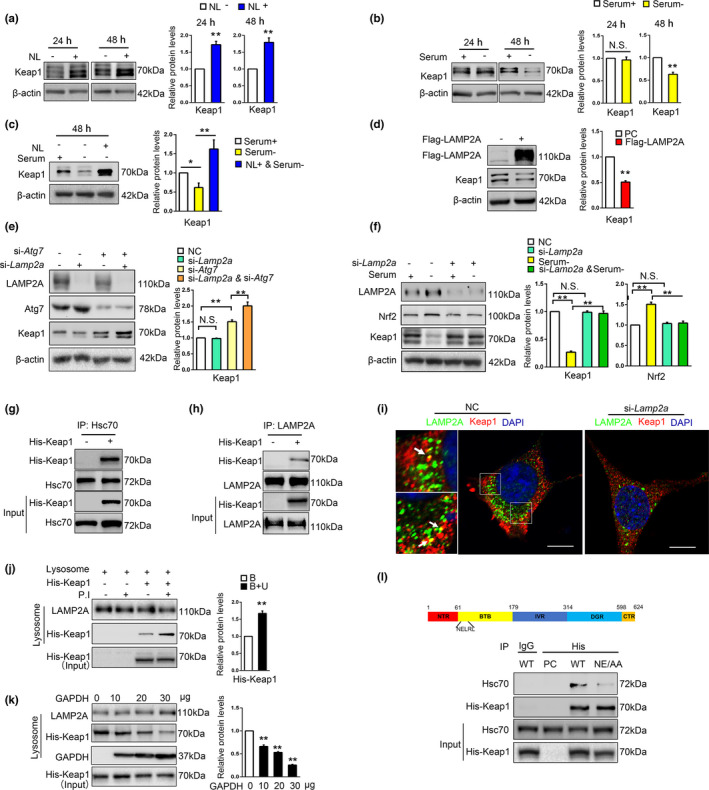
FIGURE 3.

Keap1 is a CMA substrate. (a). The effect of NL on Keap1 protein. SN4741 cells were treated with NL (20 mM NH4Cl and 100 mM leupeptin) for indicated time. Cell lysates were analyzed by immunoblot with indicated antibodies. Right panel shows the relative Keap1 level normalized to β‐actin (Student's t test, mean ± SEM, n = 3 independent experiments, **p < 0.01). (b). The effect of serum deprivation on Keap1 protein level. SN4741 cells were maintained in serum‐free media for 24 and 48 h. The cell lysates were analyzed by immunoblot with the indicated antibodies. Right panel shows the relative Keap1 level normalized to β‐actin (Student's t test, mean ± SEM, n = 3 independent experiments, **p < 0.01). (c). Change of Keap1 protein level after prolonged serum deprivation and lysosome inhibition. SN4741 cells were treated with serum deprivation and concurrent treatment of NL for 24 and 48 h. Cell lysates were analyzed by immunoblot with indicated antibodies. Right panel shows the relative Keap1 level normalized to β‐actin (Student's t test, mean ± SEM, n = 3 independent experiments, *p < 0.05, **p < 0.01). (d). The effect of LAMP2A on endogenous Keap1 protein. SN4741 cells were transfected with Flag‐LAMP2A plasmid for 48 h. Cell lysates were analyzed by immunoblot with indicated antibodies. Right panel shows the relative Keap1 level normalized to β‐actin (Student's t test, mean ± SEM, n = 3 independent experiments, **p < 0.01). (e). The effect of LAMP2A and Atg7 knockdown on the protein level of Keap1 under basal condition. SN4741 cells were transfected with control, si‐Lamp2a, or si‐Atg7 for 48 h. Lysates were analyzed by immunoblot with indicated antibodies. Right panel shows the relative Keap1 level normalized to β‐actin (Student's t test, mean ± SEM, n = 3 independent experiments, **p < 0.01). (f). The effect of LAMP2A knockdown on serum deprivation‐induced change of Keap1. SN4741 cell were transfected with si‐Lamp2a and treated with serum deprivation for 48 h. The cell lysates were analyzed by immunoblot with indicated antibodies. Right panel shows the relative Keap1 and Nrf2 level normalized to β‐actin (Student's t test, mean ± SEM, n = 3 independent experiments, **p < 0.01). (g). The interaction between exogenous His‐Keap1 and Hsc70. SN4741 cells were transfected with control or His‐Keap1. Co‐IP assays were carried out with an anti‐Hsc70 antibody for IP and an anti‐His antibody for IB. The input represents 10% of total cell lysates. (h). The interaction between exogenous His‐Keap1 and LAMP2A. SN4741 cells were transfected with control or His‐Keap1. Co‐IP assays were carried out with an anti‐LAMP2A antibody for IP and an anti‐His antibody for IB. The input represents 10% of total cell lysates. (i). Analysis of the interaction between Keap1 and LAMP2A by immunofluorescence assay. Keap1 and LAMP2A were stained as red (Alexa Fluor 594) and green (Alexa Fluor 488), respectively. Representative images are shown and the areas of interest are enlarged. The colocalization of Keap1 and LAMP2A is indicated by a yellow color (arrow). Cells treated with si‐Lamp2a were used as a negative control (right graph). Scale bar: 10 μm. (j). In vitro binding and uptake assay of Keap1 by lysosomes. The purified lysosomes with or without a cocktail of P.I (P.I, protease inhibitors) were incubated with purified GST‐Hsc70 and the lysates of SN4741 cells overexpressing His‐Keap1 for 30 min at 37℃. After washing, the presence of His‐Keap1 was determined by immunoblotting. The presence of P.I should block lysosomal degradation, and thus, such conditions should measure both Keap1 binding to and taken up by lysosomes, whereas in the absence of P.I, this assay only measures Keap1 binding to lysosomes. The input represents 10% of total cell lysates. Right panel shows the relative Keap1 level normalized to LAMP2A (B: binding; U: uptake) (Student's t test, mean ± SEM, n = 3 independent experiments, **p < 0.01). (k). The effect of a known CMA substrate GAPDH on the association of Keap1 with lysosomes. The experiment was carried out as in (j) with or without increasing concentrations of GAPDH for 30 min at 37℃. Right panel shows the relative Keap1 level normalized to LAMP2A (Student's t test, mean ± SEM, n = 3 independent experiments, **p < 0.01). (l). Identification of KFERQ motif required for Keap1 and Hsc70 interaction. Top graph: domain structure of Keap1 protein. Bottom: Lysates of HEK293T cells transfected with wild‐type (WT) and mutated (NE/AA) His‐Keap1 were immunoprecipitated with an anti‐His antibody and immunoblotted with indicated antibodies
