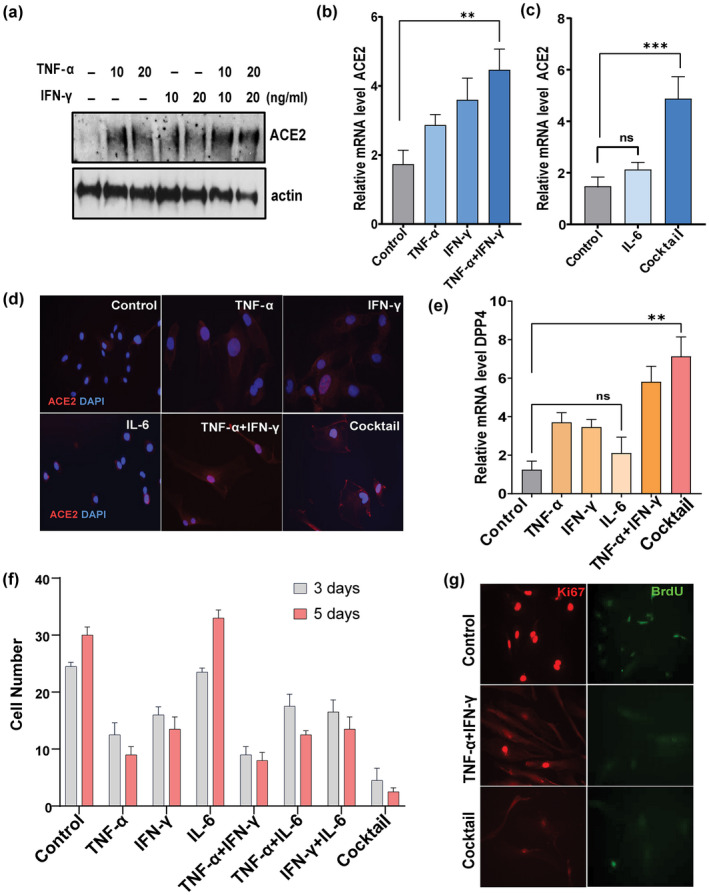
FIGURE 2.

TNF‐α/IFN‐γ synergistically increase ACE2 and DPP4 and inhibit proliferation. (a) Western blot for ACE2 in HUVECs exposed to TNF‐α, IFN‐γ, or both for 3 days at the indicated concentrations. (b, c) relative expression of ACE2 in cells stimulated with TNF‐α, IFN‐β, IL‐6 or TNFα+IFN‐γ individually or as a cocktail (TNF‐α + IFN‐γ + IL‐6). (d) Immunostaining for cell surface expressed‐ACE2 (red) and DAPI (blue) in cells exposed to the indicated cytokines. DAPI staining indicates nuclear DNA. (e) Real‐time expression of DPP4 in cells exposed to the indicated cytokines. (f) Graph represents cell number as % of control after 3 and 5 days of stimulation with cytokines as indicated. (g) Immunostaining for the proliferation indicator, Ki67 (red), and the cell cycle marker, BrdU (green), in cells exposed to cytokines for 5 days. Data are representative of two (a, d, g) or three (b, c, e, f) independent experiments. Error bars show mean ± SD, *p < 0.05, **p < 0.01, ***p < 0.001; ns: Non‐significant
