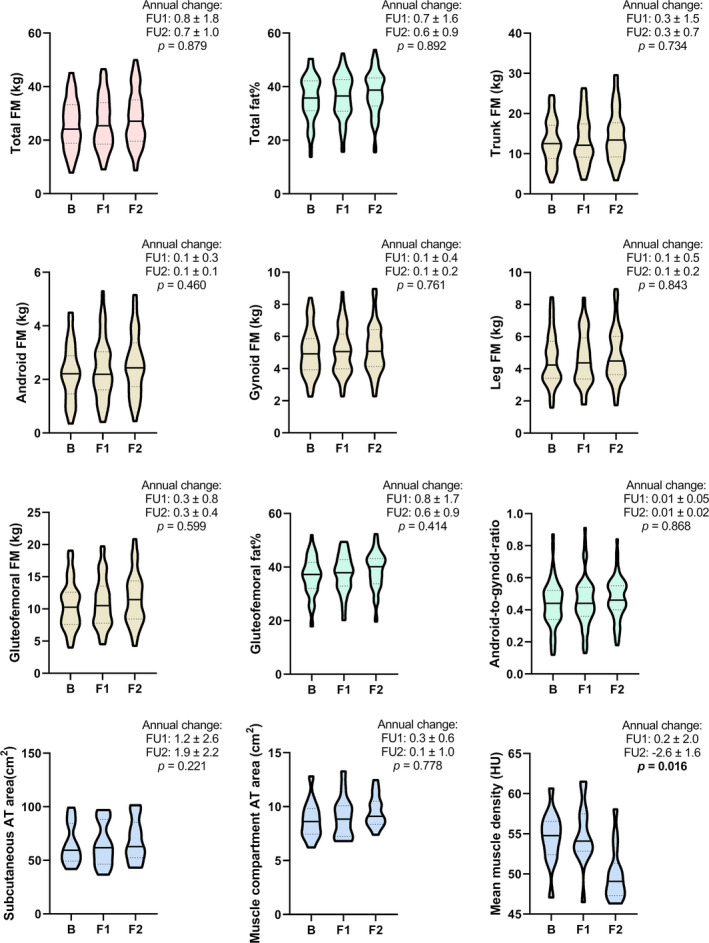
FIGURE 2.

Body adiposity variables of participants assessed at three measurement points during the study (n = 59 for three upper rows and n = 14 for bottom row variables). Violin plots show the median (vertical line), interquartile ranges (dashed lines), and max‐ and min‐values (upper and lower limits). Annual changes are presented as median ± SD. B, baseline measurement; F1, first follow‐up measurement; F2, second follow‐up measurement; FU1, follow‐up from perimenopause to early postmenopause (time between B and F1); FU2, follow‐up from early postmenopause to later postmenopause (time between F1 and F2); FM, fat mass; AT, adipose tissue; HU, Hounsfield unit. Significant p‐values (p < 0.05) between annual changes are highlighted
