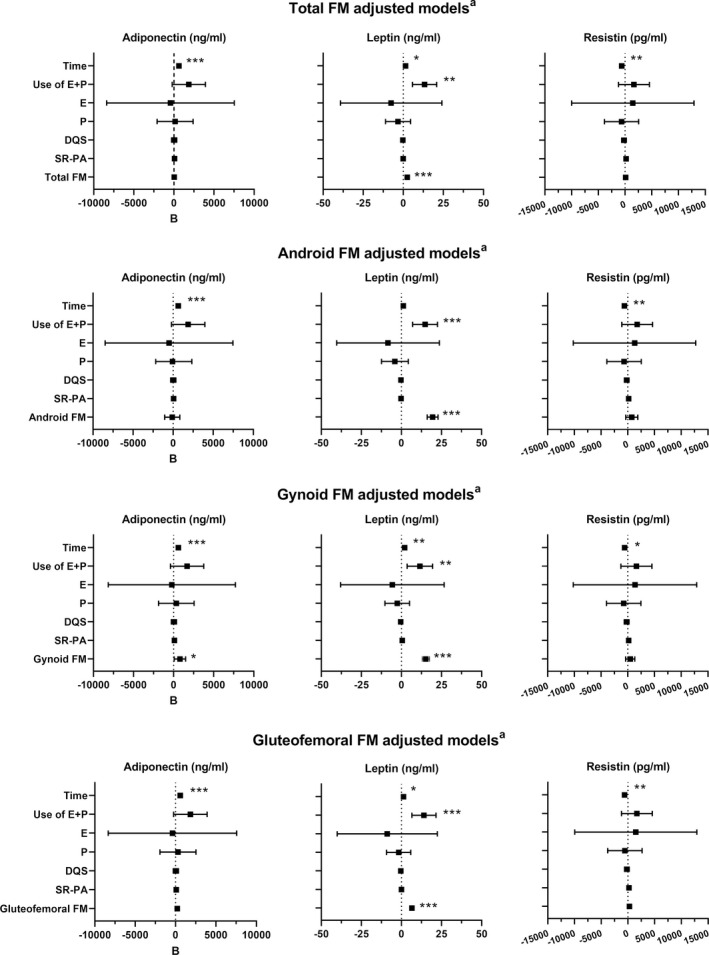
FIGURE 3.

Results from the adjusted adipokine and adiposity variables linear mixed‐effect models (total observations n = 276). Black squares represent the B coefficient of the model covariates, while lines represent the 95% confidence interval. Time, follow‐up time in years; Hormone use, the reference group is non‐users; E, estrogen; P, progestogen; DQS, diet quality score; SR‐PA, self‐reported physical activity (MET‐hours/day); MET, metabolic equivalent of task; FM, fat mass (kg). All models were also adjusted for centered baseline age and education. ***p < 0.001 **p < 0.01, *p < 0.05
