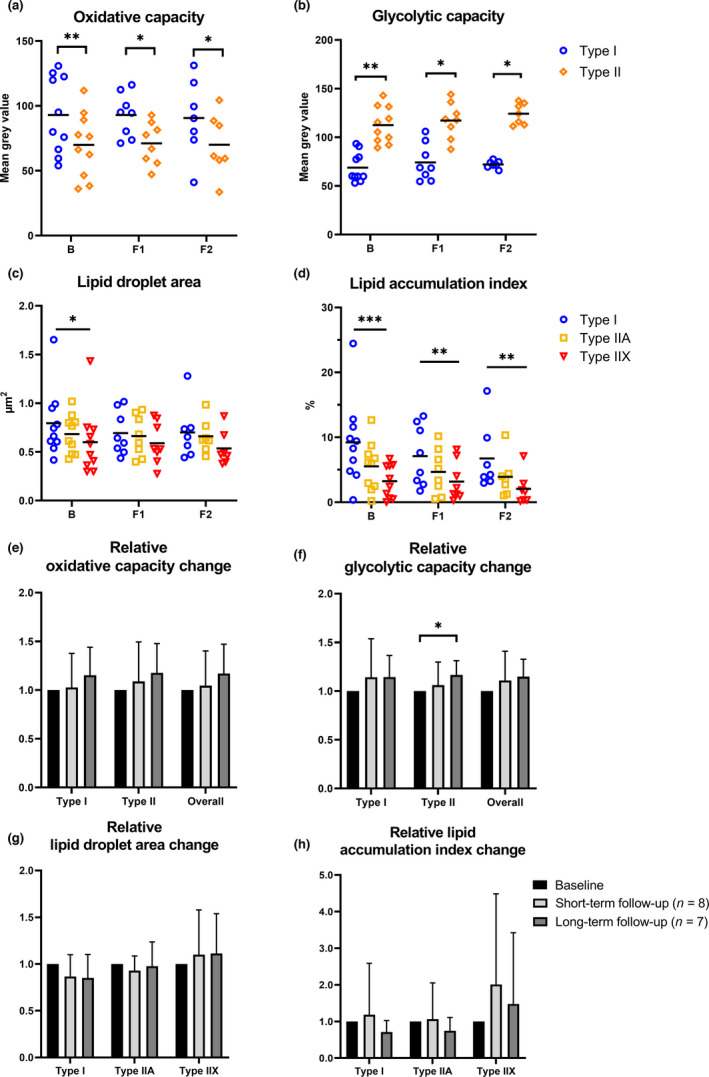
FIGURE 4.

Biopsy results (n = 7–10). Oxidative and glycolytic capacities, lipid droplet area, and lipid accumulation index in different fiber types at baseline (B), short‐term follow‐up point (F1), and long‐term follow‐up point (F2) (Figure 4a‐d). In 4A‐D, horizontal lines represent mean values. Figure 4e‐h shows relative paired changes in oxidative and glycolytic capacity, lipid droplet area, and lipid accumulation index per fiber type, where baseline values were set as a reference value (=1) between short‐ and long‐term follow‐ups. Here, values are presented as mean ± SD. ***p < 0.001, **p < 0.01, *p < 0.05.
