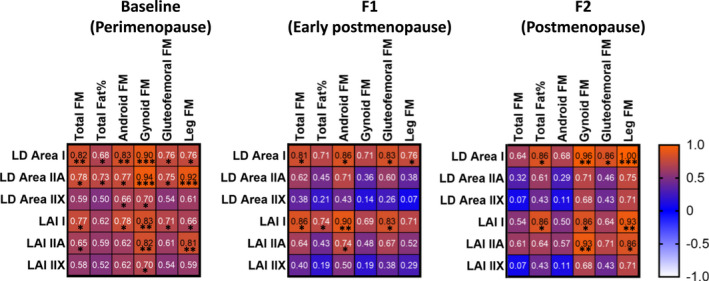
FIGURE 5.

Correlation matrix of muscle fiber and body adiposity variables at three measurement points (n = 7–10). Correlation strength and direction are illustrated by correlation coefficient and background color. Red indicates a strong positive correlation and white indicates a strong negative correlation. F1, short‐term follow‐up point; F2, long‐term follow‐up point; FM, fat mass; LD, lipid droplet; LAI, lipid accumulation index. ***p < 0.001, **p < 0.01, *p < 0.05.
