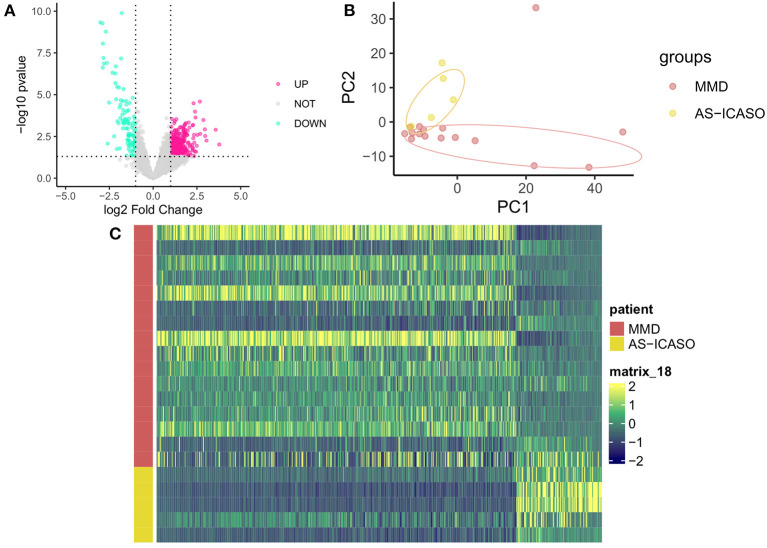
Figure 2.
Dysregulated genes in MCA specimens from MMD and AS-ICASO controls. (A) A volcano plot to visualize the DEGs between MMD and AS-ICASO controls. Magenta dots represent significantly (p < 0.05 and fold change >2) upregulated genes (n = 449), and indigo dots represent significantly downregulated genes (n = 107). Gary dots represent the genes that are not differentially expressed. (B) A principal component analysis (PCA) biplot for PC1 and PC2, performed using all of the normalized values obtained from the sequencing data, shows two separate clusters for MMD and AS-ICASO controls. Dark red dots represent patients with MMD, yellow dots represent participants with AS-ICASO. (C) Heatmap shows a distinct expression pattern of DEGs between MMD and AS-ICASO controls. The color key at the right indicates a relative gene expression. Yellow and green colors represent higher and lower gene expression levels, respectively.

