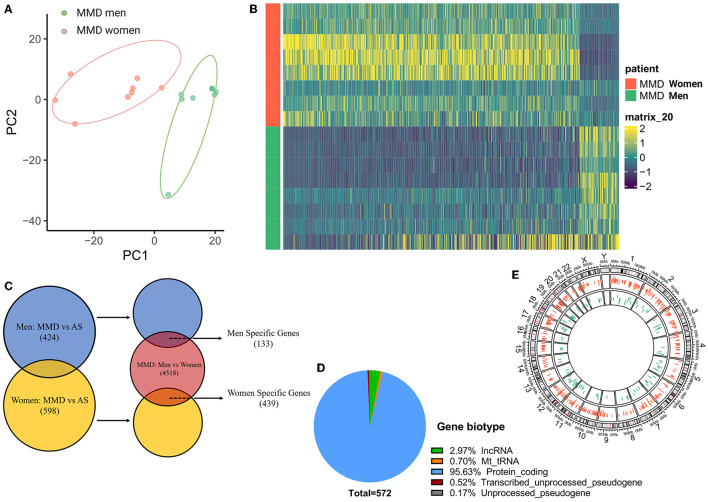
Figure 5.
Sex differences between adult men and women patients with MMD. (A) PCA analysis, performed using all of the normalized values obtained from the sequencing data, showed two separate clusters for men and women with MMD. Green dots represent men patients with MMD, red dots represent women participants with MMD. (B) Heatmap showed a distinct gender expression pattern of DEGs in MMD. The color key at the right indicates a relative gene expression. Yellow and green colors represent higher and lower gene expression levels, respectively. (C) Venn plot of sex-specific DEGs showed specific genes in men and women patients with MMD. Blue color represents men with MMD vs. men with AS-ICASO, yellow color represents women with MMD vs. women with AS-ICASO, and orange color represents men with MMD vs. women with MMD. (D) Gene biotype of all sex-specific genes. (E) Chromosome distribution of sex-specific genes shows that 95.49 and 96.59% of the genes are autosomal genes in men and women, respectively. Green bar represents men patients with MMD, red bar represents women patients.

