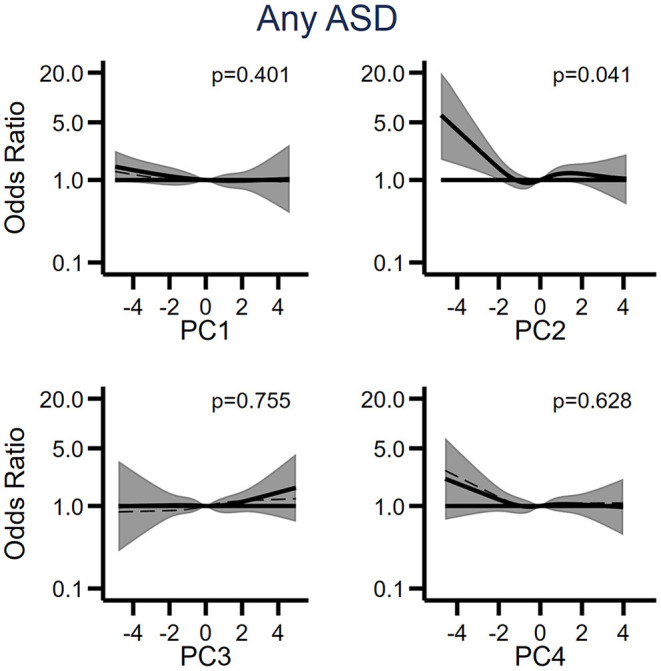
Figure 4.

The relationship between the first four principal components (PC1-PC4) derived from cytokines and acute phase proteins, and odds of ASD when comparing 318 individuals affected by ASD to 429 unaffected individuals selected from the cohort. Each panel displays the odds of ASD according to principal component scores, flexibly fit using restricted cubic spline models with four knots and a score = 0 as the referent. The dashed line represents the unadjusted estimate of the relationship between each principal component and odds of ASD. The solid line represents the fully adjusted model, adjusted for sex of fetus; family income quintile; maternal BMI, psychiatric history, region of origin, and age. The gray bands represent the 95% confidence interval for the fully adjusted model. P-values are shown for a Wald test with a null hypothesis that all spline terms were jointly equal to zero, as a test of whether each principal component was generally associated with the outcome. PC, principal component.
