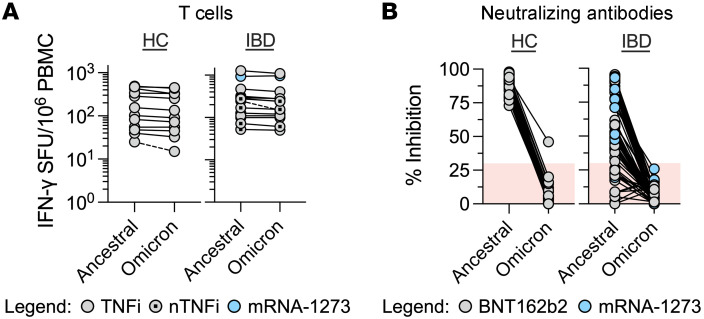
Figure 6. Cellular but not humoral responses are mostly preserved against Omicron variant spike.
(A) Dot plots denoting the number of IFN-γ SFU per 106 PBMCs generated after ancestral and Omicron variant spike peptide stimulation in HCs or IBD donor groups (day 115). Each line connects paired responses from a single donor, with broken lines denoting a difference of more than 25% responses (HC, n = 12; TNFi or TNFi+AM [TNFi ± AM], n = 8; nTNFi, n = 6). (B) Dot plots denoting the percentage inhibition of binding of SARS-CoV-2 S-RBD to hACE2 by sVNT from donor sera (day 115). Each line connects paired responses from a single donor (HC, n = 50; IBD, n = 63). Shaded red regions denote data with negative result calls.

