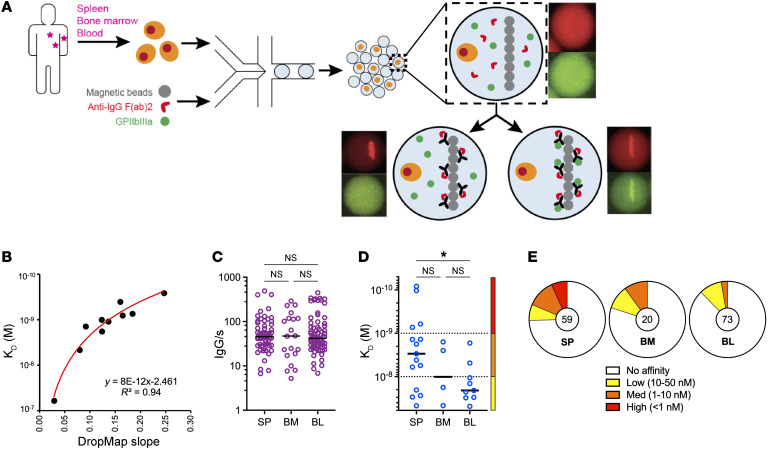
Figure 1. Single-cell analyses reveal αIIbβ3 affinity and secretion rate from IgG-SCs.
(A) Schematic of the DropMap pipeline. Single mononuclear cells are encapsulated in droplets, together with magnetic beads coated with anti–κ light chain nanobody (VHH) and fluorescently labeled anti-IgG F(ab′)2–Alexa Fluor 647 (red) and αIIbβ3–Alexa Fluor 488 (green). Droplets are immobilized in the chip, exposed to a magnetic field to induce beads to form a beadline, and imaged over time. (B) αIIbβ3 affinity reference curve generated using anti-αIIbβ3 mAbs with known KD and values obtained from DropMap experiments using these mAbs. (C–E) DropMap analysis of spleen (SP), bone marrow (BM), and blood (BL) samples from patient F at the time of splenectomy. (C) IgG secretion rate. (D) Affinity for αIIbβ3 (KD) classified into high (red), medium (orange), and low (yellow) affinity, with dotted lines separating these categories. (E) Distribution of IgG-SCs into low (yellow), medium (orange), and high (red) affinity binders to αIIbβ3 or nonbinders (white), with total IgG-SC numbers indicated. (C and D) Single-cell values and medians are plotted. *P < 0.05 using Welch’s t test and multiple-testing P-value adjustment. NS, not significant. See Supplemental Table 2 for further details.

