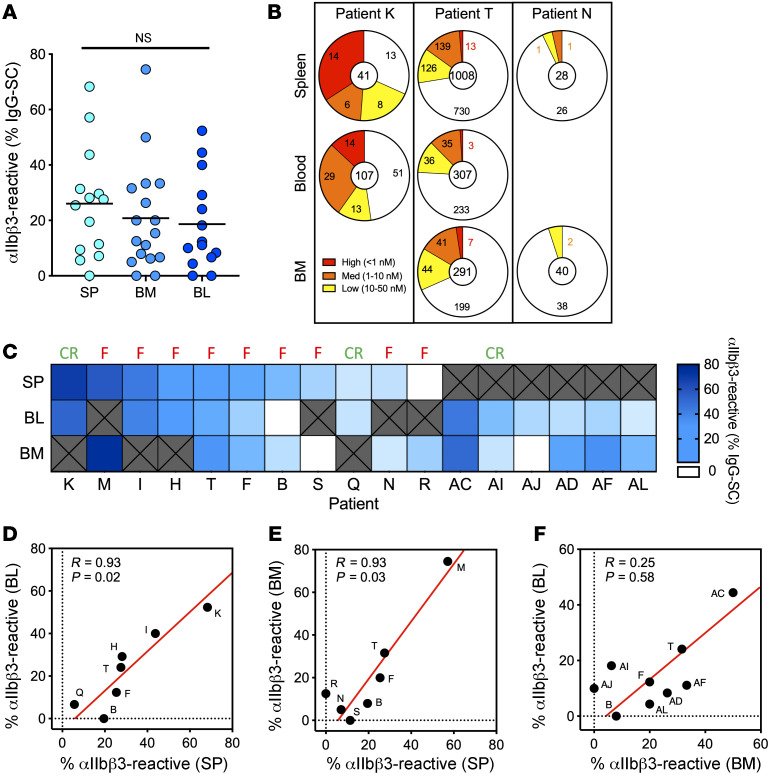
Figure 3. Paired organs demonstrate a comparable autoantibody response.
(A) Frequency of αIIbβ3-reactive IgG-SCs among total IgG-SCs in the spleen (SP), bone marrow (BM), and blood (BL) from individual patients with ITP. Each dot represents an individual. Values are pooled data from 2 replicates. NS, not significant using Welch’s t test and multiple-testing P-value adjustment. See Supplemental Table 2 for further details. (B) Distribution of IgG-SCs into low (yellow), medium (orange), and high (red) affinity binders to αIIbβ3 or nonbinders (white), with total IgG-SC numbers indicated, for paired samples of patients K, T, and N. (C) Heatmap of the frequency of αIIbβ3-reactive cells among IgG-SCs per patient, ordered from most frequent to less frequent in spleen for patients with a spleen sample, and ordered from most frequent to less frequent in blood for patients without a spleen sample. White boxes indicate undetectable reactivity for αIIbβ3, and “X” indicate absence of samples. Result of splenectomy is indicated: complete remission (CR) or failure (F). (D–F) Pearson’s correlation analysis of data from C; scatterplots compare the frequency of αIIbβ3-reactive cells among paired organs. R and adjusted P values are indicated. Red line indicates the reduced major axis.

