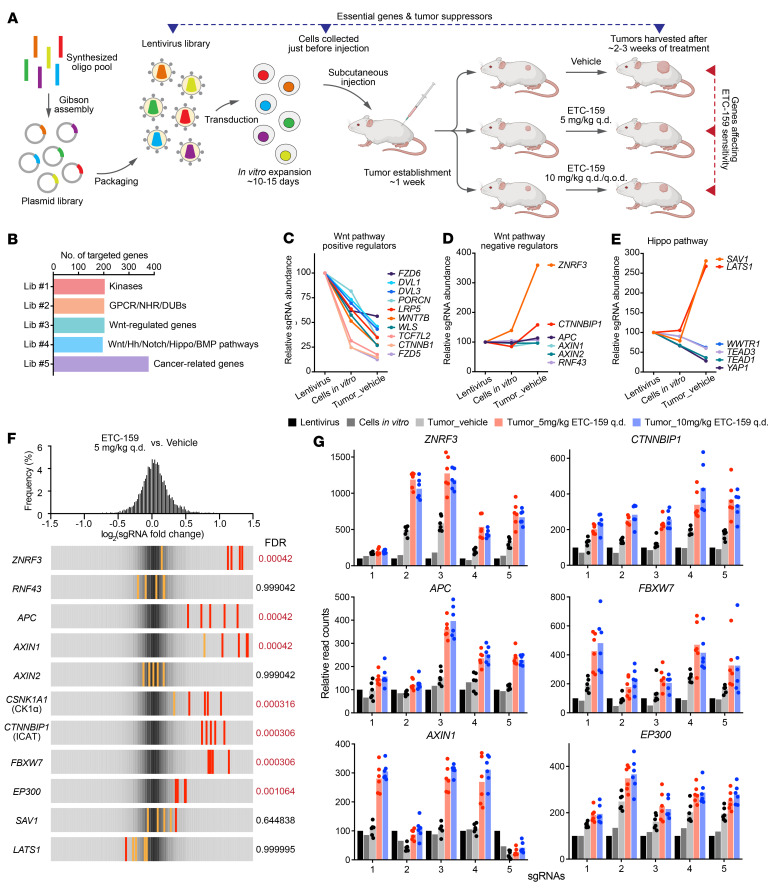
Figure 2. In vivo CRISPR screens identified genes whose loss caused resistance to PORCN inhibition.
(A) Schematic representation of CRISPR screens in RNF43-mutant pancreatic cancer model. Refer to the text for detailed description. (B) Custom small-scale sgRNA libraries were designed and constructed for in vivo CRISPR screens. NHR, nuclear hormone receptor; DUB, deubiquitylase; Hh, Hedgehog; Lib, library. Wnt-regulated genes were selected from DE genes upon ETC-159 treatment in HPAF-II tumors (17). (C–E) Change of the abundance of sgRNAs targeting Wnt and Hippo pathways. Values indicated are the relative median abundance of all the 5 sgRNAs targeting a specific gene. Values are set to 100 for all genes in the lentivirus libraries. (F and G) In vivo CRISPR screens identified genes, loss of which conferred resistance to PORCN inhibitor ETC-159 in RNF43-mutant pancreatic cancer. (F) The frequency distribution of each sgRNA abundance ratio (log2 fold change) in ETC-159–treated (5 mg/kg q.d.) tumors versus vehicle-treated tumors is shown on the top. Overall frequency distribution of all sgRNAs corresponds to the gray color shown in the bottom panels. For a specific gene, all 5 sgRNAs are shown in the bottom panels. Red line or orange line indicates P value calculated by MAGeCK for that specific sgRNA < 0.05 or > 0.05, respectively. Gene level sgRNA enrichment FDRs calculated by MAGeCK are shown next to the panels. (G) Individual sgRNA read count change in all the samples for representative hits shown in F. For each gene, the 5 sgRNAs are shown. For each sgRNA, its read count in the lentivirus library is normalized to 100. Each dot represents the read count in an individual tumor (n = 6).

