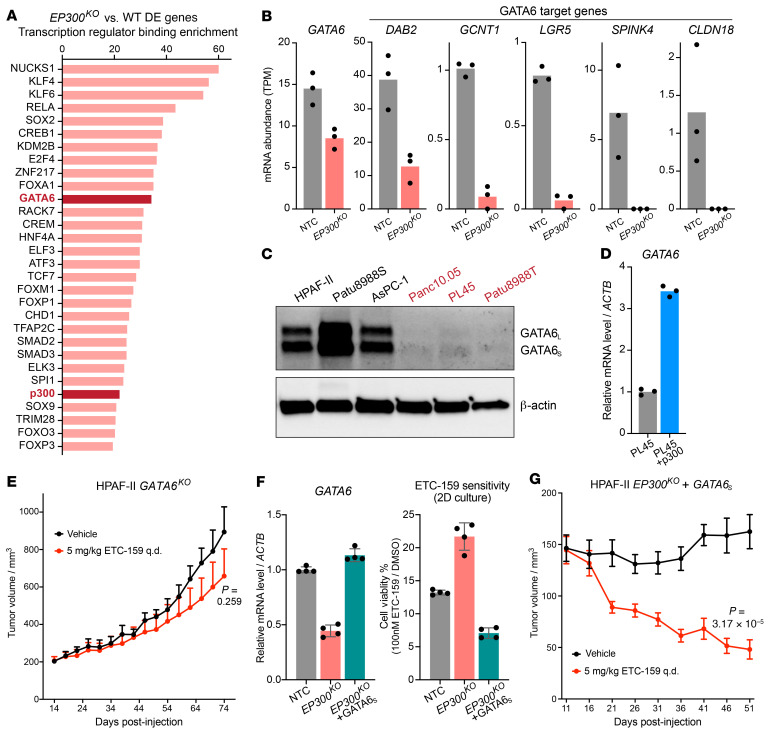
Figure 5. Loss of p300 downregulated GATA6 signaling that determined Wnt dependency.
(A) Transcription regulator binding enrichment analysis of DE genes. The top 30 enriched transcription regulators are shown. Bars represent the enrichment score. (B) EP300 knockout reduced the expression of GATA6 and GATA6 target genes in HPAF-II orthotopic tumors. Each dot represents an independent tumor. (C) EP300 mutation correlates with loss of GATA6 protein in RNF43-mutant pancreatic cancer cell lines. The PORCN inhibitor–resistant EP300-mutant lines are labeled in red. GATA6 has 2 isoforms due to alternative translation start sites. (D) Reexpressing WT EP300 in PL45 cells restored GATA6 expression. mRNA abundance was determined by RT-qPCR (n = 3 technical replicates). (E) GATA6 knockout conferred resistance to PORCN inhibitor in HPAF-II tumors. The experiment was performed as in Figure 4B. HPAF-II cells transduced with sgGATA6 #5 (Supplemental Figure 10B) were used. Treatment was started 14 days after injection. Data are represented as mean + SEM (n = 8 tumors/arm). P value of 2-tailed, unpaired t test for tumor volume at the last time point is shown. (F and G) Ectopic expression of the short isoform of GATA6 in EP300-knockout HPAF-II cells rescued ETC-159 sensitivity in vitro and in vivo. (F) GATA6 mRNA abundance was determined by RT-qPCR (n = 4 technical replicates). Cells seeded in 24-well plates at low density were treated with DMSO or 100 nM ETC-159 until the DMSO wells reached confluency. Cell viability was measured by crystal violet staining (n = 4 biological replicates). Data are represented as mean ± SD. (G) The effect of GATA6S expression was assessed as in Figure 4B. Treatment was started 11 days after injection. Data are represented as mean ± SEM (n = 8 tumors/arm). P value of 2-tailed, unpaired t test comparing tumor volumes at the last time point is shown.

