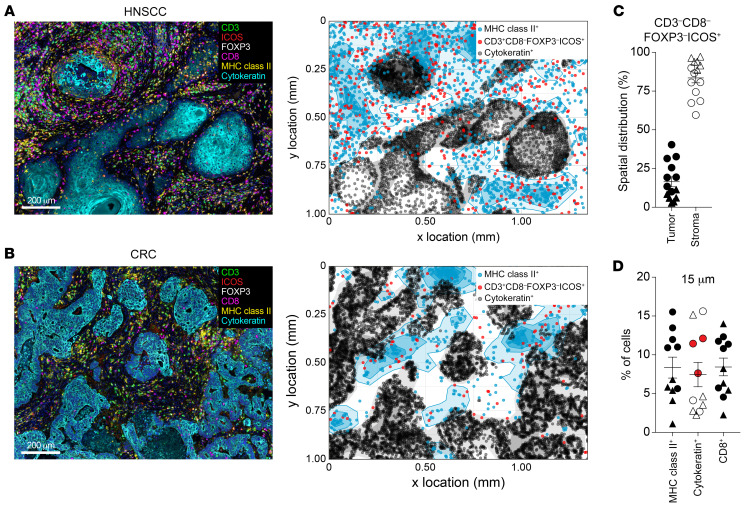
Figure 4. DP CD4+ Th cells are in the tumor stroma proximal to MHC class II+ cells.
mIHC for CD3, CD8, FOXP3, ICOS, MHC class II, and cytokeratin on FFPE tissue sections from HNSCC and CRC tumors. Representative ROIs (left) from an HNSCC tumor (A) and a CRC tumor (B) and the corresponding cellular spatial relationship maps (right). Scale bars: 200 μm. The maps show cytokeratin+ cells (tumor) in black, MHC class II+ cells in blue, and CD3+CD8–FOXP3–ICOS+ (DP CD4+ Th cells) in red. (C) Analysis of the distribution of CD3+CD8–FOXP3–ICOS+ (DP CD4+ Th cells) in the tumor stroma and tumor epithelium in 14 tumors (n = 8 HNSCC and n = 6 CRC). (D) Neighbor’s cell analysis was performed on 11 tumors (n = 6 HNSCC and n = 5 CRC). The proportion of MHC class II+ cells in the stroma and cytokeratin+ cells detected within a 15 μm radius from CD3+CD8–FOXP3–ICOS+ (DP CD4+ Th) cells is indicated as the frequency of total cells. Circles represent HNSCC tumors, and triangles represent CRC tumors. Horizontal lines indicate the mean ± SEM. Data for patients with MHC class II–expressing tumor cells are shown in red in D.

