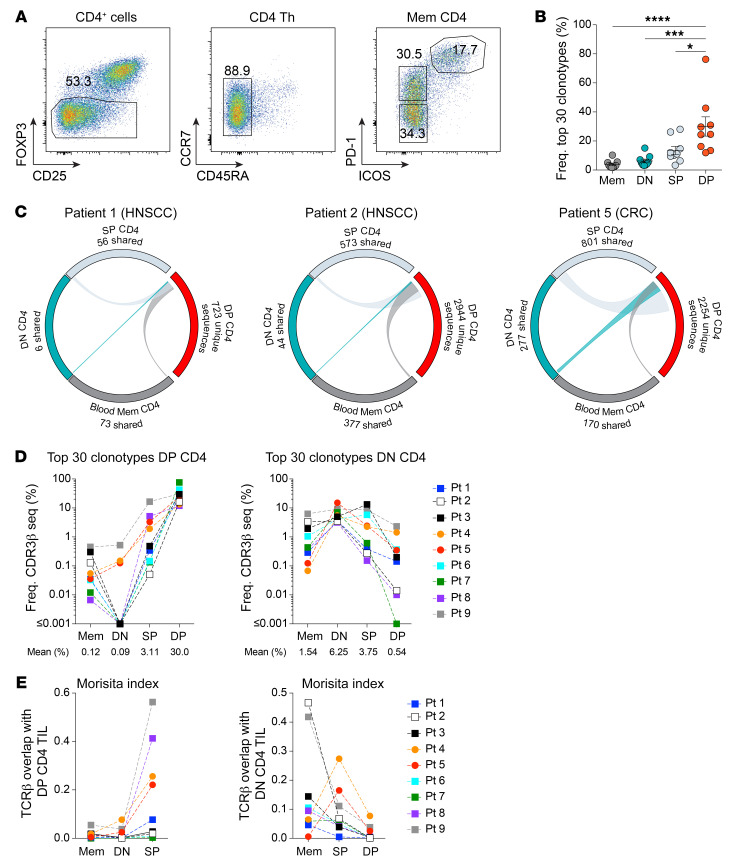
Figure 6. DP CD4+ Th TILs have a unique and oligoclonal TCR repertoire.
(A) Gating strategy for the TCR repertoire analysis. (B) Cumulative frequencies of the top 30 clonotypes for each CD4+ Th subset in 9 patients with cancer. (C) Circos plots of unique productive TCRβ nucleotide sequences from each of the indicated cell subsets. Connections highlight sequences from DP CD4+ TILs found in the other CD4+ Th cell populations. The number of shared sequences is indicated. Circos plots for 2 patients with HNSCC and 1 patient with CRC are shown. (D) Cumulative frequencies of the top 30 clonotypes from DP CD4+ TILs (left) and DN CD4+ TILs (right) in 9 patients (Pt) with cancer. Their frequencies in blood memory CD4+, DN, SP, and DP CD4+ TILs are represented. (E) Similarity between the TCR repertoires of the different CD4+ T cell subsets was measured using the Morisita-Horn index for 9 patients with cancer. Each color represents a distinct patient connected with a dashed line (D and E). Horizontal lines indicate the mean ± SEM. *P < 0.05, ***P < 0.001, and ****P < 0.0001, by 1-way ANOVA with Tukey’s post hoc test (B).

