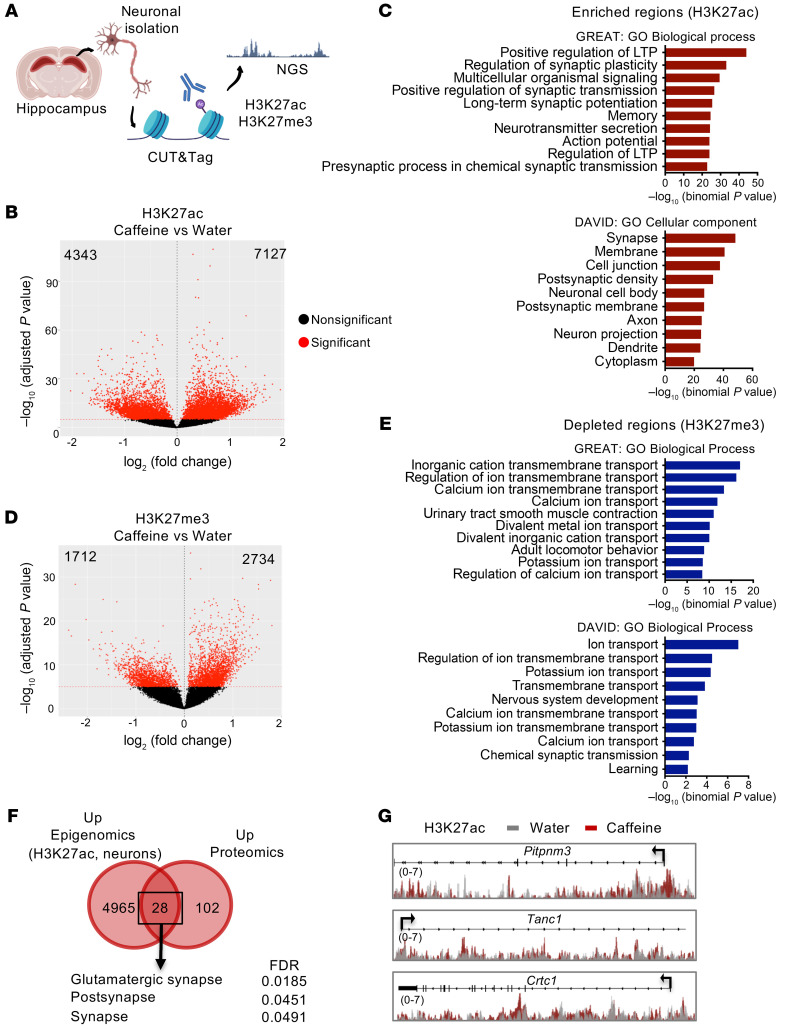
Figure 4. Neuron-specific H3K27ac and H3K27me3 changes induced by chronic caffeine consumption.
(A) Schematic of the experimental design used to assess the active (H3K27ac) and repressive (H3K27me3) histone marks by the CUT&Tag technique in a hippocampal neuron-enriched population. NGS, next-generation sequencing. (B) Volcano plot representing H3K27ac differentially regulated regions (4343 depleted and 7127 enriched, FDR < 1 × 10⁻⁵). (C) Top: GREAT analysis showing the most-enriched biological processes associated with the H3K27ac-enriched peaks in caffeine-treated mice, primarily related to synaptic transmission. Bottom: DAVID Gene Ontology analysis revealing the most significant cellular components associated with H3K27ac-enriched regions. (D) Volcano plot showing H3K27me3 differentially regulated regions between the water- (control) and caffeine-treated mouse hippocampus (1712 depleted and 2734 enriched, FDR < 1 × 10⁻⁵). (E) Top: GREAT analysis showing that depleted regions are mostly associated with ion transport processes. Bottom: DAVID Gene Ontology analysis indicating the most significant biological processes associated with H3K27ac-enriched genes in neurons. (F) Venn diagram showing that 28 proteins were increased by caffeine and enriched in H3K27ac at their coding genes. These proteins are mostly associated with glutamatergic synapse (STRING analysis). (G) Representation (using IGV) of H3K27ac-enrichement of genomic regions at 3 genes in neurons from mice treated with water or chronic caffeine. Two biological replicates per histone mark were used for CUT&Tag experiments.

