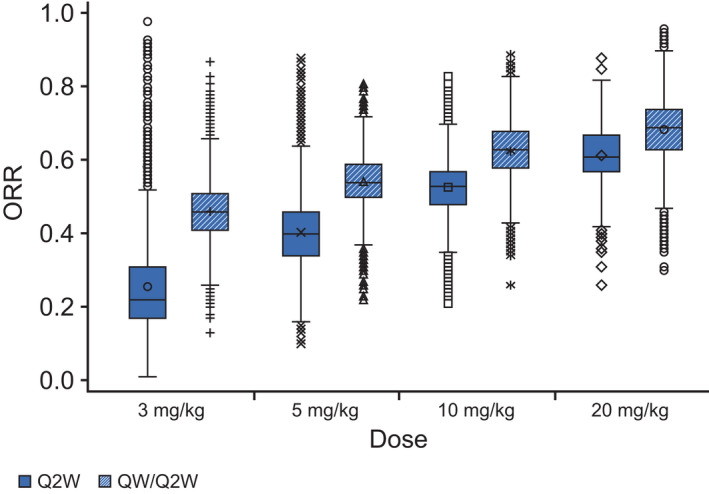
FIGURE 4.

Mean predicted overall response rate (ORR) increases with increasing isatuximab dose. Results for 5000 trials based on simulated plasma trough concentration at week 4 (CT4W; using the final model) from 52 resampled patients treated with isatuximab plus lenalidomide/dexamethasone, with 100 patients each. Boxplots based on the model with log CT4W, β2‐microglobulin (<3.5, ≥3.5) and number of prior lines (≤5, >5). Symbols represent individual values for each treatment group. Q2W, every 2 weeks; QW, weekly
