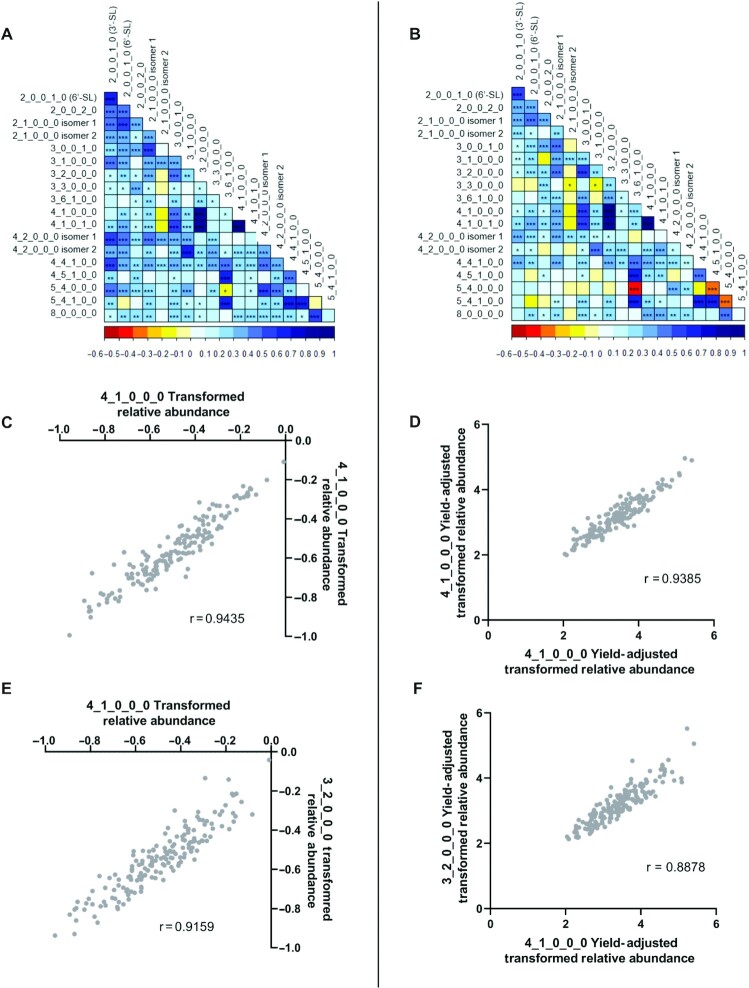
FIGURE 2.
Pearson's correlations among oligosaccharide pairs for nonyield corrected (left) and yield-corrected (right) relative abundance (signal intensity) data organized as heat maps for all oligosaccharide pairs (A & B), as well as individual plots for the strongest correlations between 4_1_0_0_0 and 4_1_0_1_0 (C, r = 0.9435 & D, r = 0.9385), and between 4_1_0_0_0 and 3_2_0_0_0 (E, r = 0.9159 & F, r = 0.8878). BMOs are described by their monosaccharide compositions as the number of hexose_N-acetylhexosamine_fucose_N-acetylneuraminic acid_N-glycolyneuraminic acid (Hex_HexNAc_Fuc_Neu5Ac_Neu5Gc), followed by the isomer number, as appropriate. *0.01 < P ≤0.05, **0.001 < P ≤0.01, ***P <0.001. BMO, bovine milk oligosaccharide.

