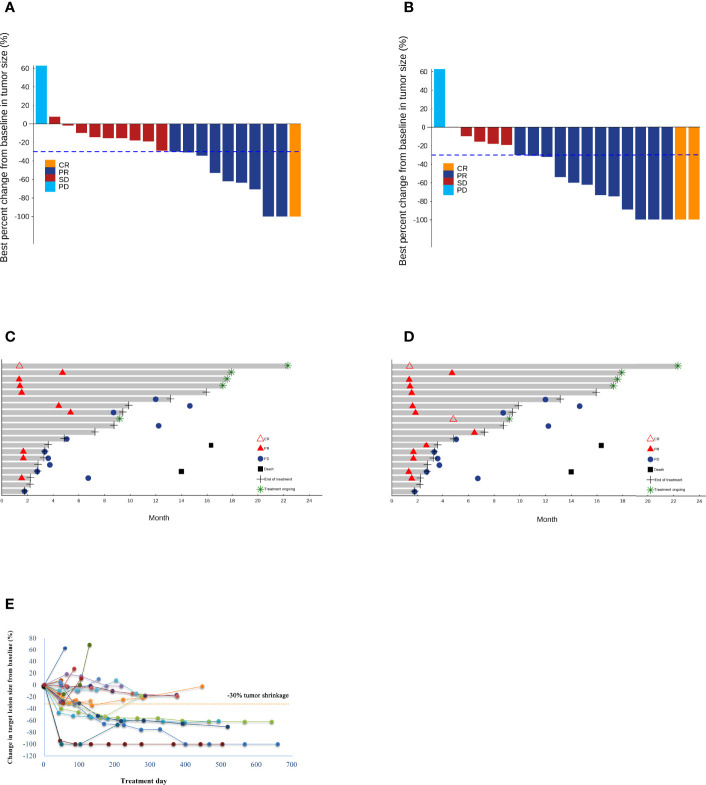
Figure 2.
Waterfall plots of the best percentage changes for the sum of target lesion diameters after treatment are shown for individual patients with best objective response per RECIST v1.1 (A) and modified RECIST (B) as indicated by the color codes. Both investigator-confirmed and unconfirmed responses are included. The dotted line indicates a 30% reduction in the target lesion size. Swimmer plots of time to tumor response (months) of individual unresectable or metastatic hepatocellular carcinoma patients. Responses were evaluated by RECIST v1.1 (C) and modified RECIST (D). Each bar represents one patient in the efficacy-evaluable population. CR, complete response; PD, progressive disease; PR, partial response; SD, stable disease. (E) The spider plot presents individual changes in tumor measurements over time relative to baseline tumor burden in the study patients. Patients are coded in different colors.

