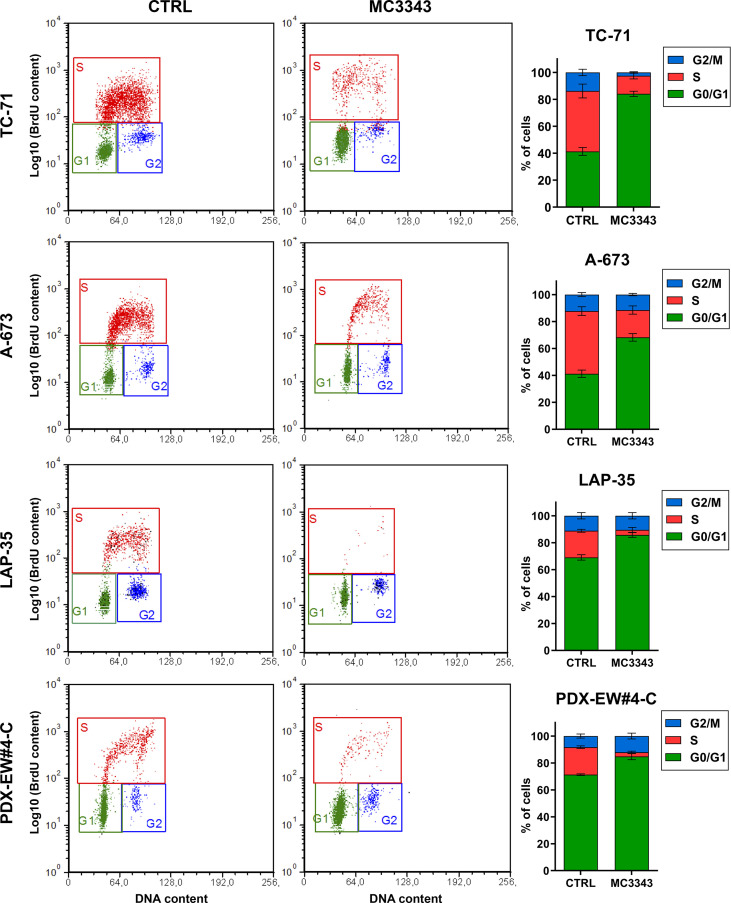
Figure 2.
MC3343 induces a G1 block in EWS cells. Cell-cycle analysis of four representative EWS cell lines after 24 h of exposure to MC3343 as determined by BrdU uptake. x-axis indicates DNA content (PI) and y-axis indicates BrdU incorporation (log10). In each panel, the different stages of the cell cycle are highlighted. Percentages of cells in each cell-cycle stage are shown in histograms on the right. Data represent the mean ± SE of at least three experiments.

