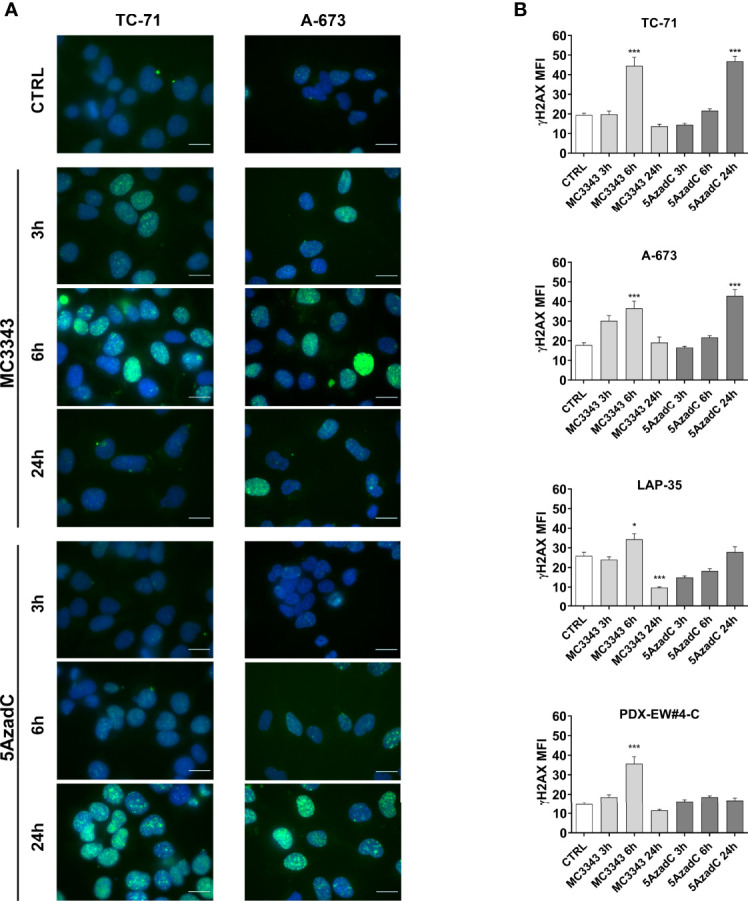
Figure 3.

MC3343 and 5azadC kinetics of DNA damage induction. (A) Merged immunofluorescence of TC-71 and A-673 staining for γH2AX (green) and DAPI (blue) after 3, 6 and 24h of treatment with DMSO, MC3343 or 5azadC. Digital images were acquired under identical conditions at the same time, using image analysis software (NIS Elements, Nikon). Representative images are shown. Scale bars, 20 µm. (B) DNA DSBs measured by levels of mean fluorescence intensity (MFI) of γH2AX positive nuclei in at least 20 different fields for each condition. (*p < 0.05; ***p < 0.001, one-way ANOVA test).
