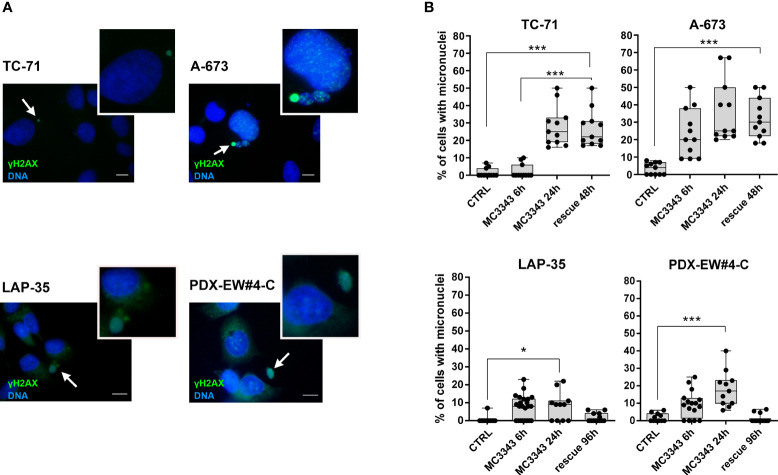
Figure 4.
MC3343 treatment induces micronuclei formation. (A) Representative images of γH2AX (green) and DNA (Hoechst 33258, blue) staining of EWS cells following treatment with MC3343. The white arrows indicate micronuclei that contains DSBs (as indicated by DNA and γH2AX double-staining). Scale bars, 10 µm. (B) Percentage of micronuclei in EWS cells treated with MC3343 at the indicated times and after 48-96h of rescue with drug-free medium replacement. Data are presented as the mean percentage of micro-nucleated cells quantified from at least 20 random fields (mean ± SE; *p < 0.05, ***p < 0.001, one-way ANOVA test).

