Figure 6.
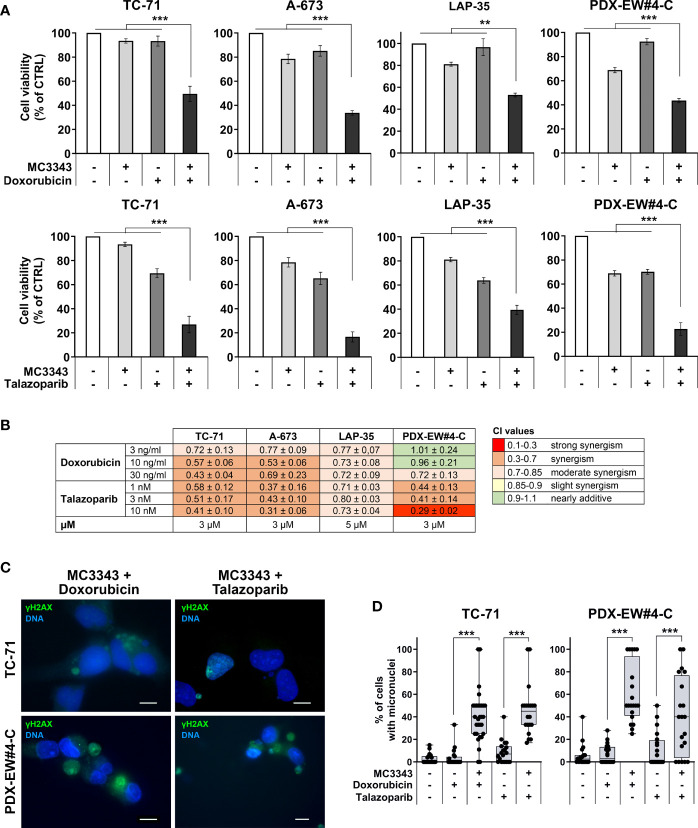
Synergism of combined treatments with DNA damaging drugs. (A) TC-71, A-673, LAP-35 and PDX-EW#4-C cells were treated for 24h with 3-5 µM MC3343 and, after wash-out, treated for 48h with 3-10 ng/mL of doxorubicin or 3-10 nM of talazoparib. Cell viability was measured by trypan blue vital cell counts and is expressed as the percentage of live cells with respect to the untreated control. Data are shown as mean ± SE of three independent experiments (*p < 0.05; **p < 0.01, ***p < 0.001, one-way ANOVA test). (B) Heatmap of drug interactions of sequential treatments with MC3343 and doxorubicin or talazoparib. Cell viability was assessed by trypan blue cell counts. Synergistic, additive, or antagonistic drug interactions were calculated by combination index (CI). (C) Merged immunofluorescence of EWS cells staining for γH2AX (green) and DNA (blue) after treatment with MC3343 and doxorubicin/talazoparib as indicated. Representative images are shown. Scale bars, 10 µm. (D) Percentage of micro-nucleated cells after sequential treatment with MC3343 and doxorubicin or talazoparib. Data are presented as mean percentage of micro-nucleated cells quantified from at least 20 random fields (mean ± SE; ***p < 0.001, one-way ANOVA test).

