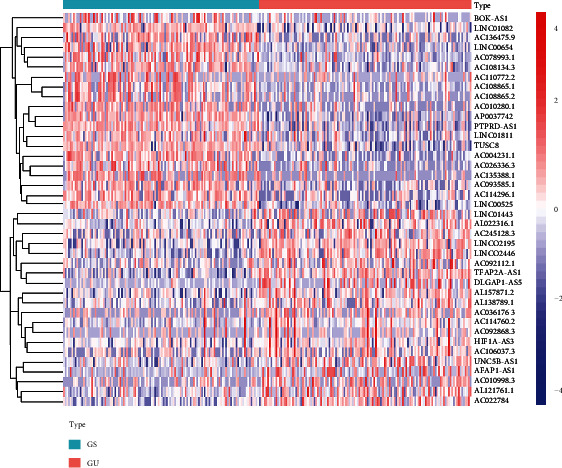
Figure 1.

Heatmap of the top 40 genomic instability-related lncRNAs with the most significant differences in expression between the groups. The genomically stable (GS) group is shown below the green line, and the genomically unstable group is shown below the red line. The genomic instability-related lncRNA names are listed on the right vertical axis (log2 fold change > 1, P < 0.01).
