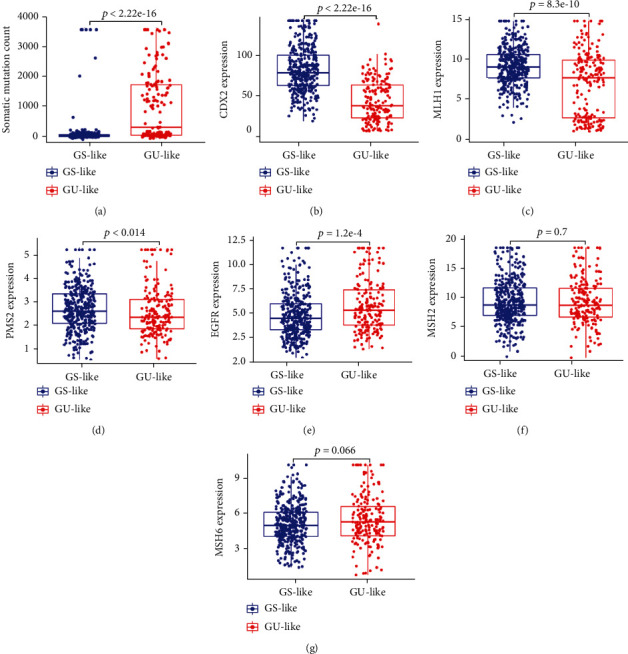
Figure 2.

Analysis of differences in mutation and genetic expression between the genomically stable-like group and the genomically unstable-like group. (a) Somatic mutation count of genes in the genomically unstable-like group (GU-like) and the genomically stable-like group (GS-like group); (b–f) relative expression of genes between the GS-like group and the GU-like group; (b) CDX2; (c) MLH1; (d) PMS2; (e) EGFR; (f) MSH2G: MSH6. Data are shown as the mean ± SD.
