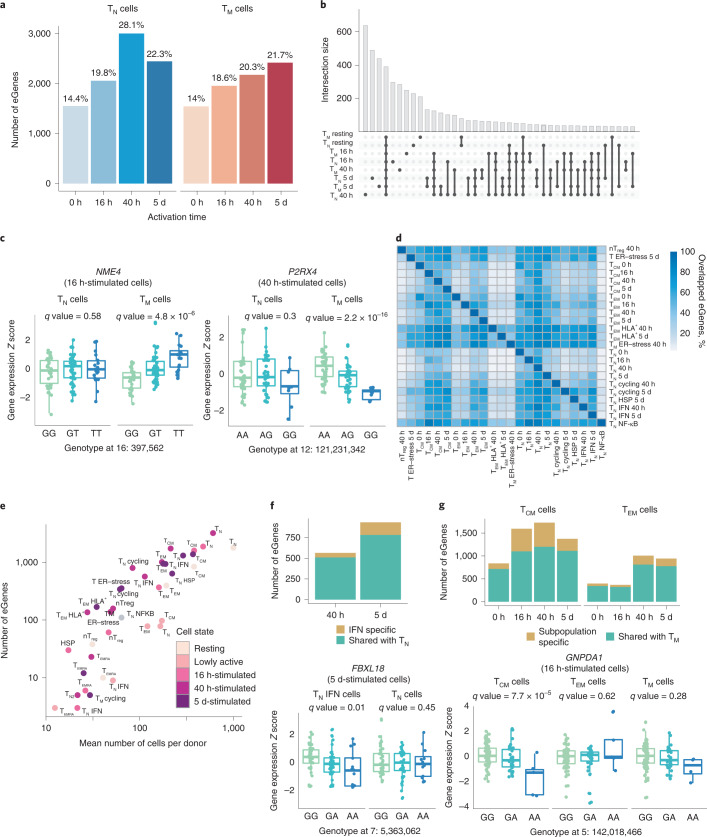
Fig. 2. eQTL mapping in resting and activated CD4+ T cells.
a, Number of significant eGenes detected at each activation time point. Colors represent cell types (blue, TN; red, TM). b, Number of significant eGenes shared between cells sampled at each time point. c, Example of T memory cell-specific eQTLs detected at 16 h and 40 h. Box plots show mean expression value of the gene in each sample (Z-scored), stratified by genotype at the genomic position of the lead eQTL variant (X axis). Each dot represents a measurement from a separate individual. Central lines indicate the median, with boxes extending from the 25th to the 75th percentiles. Whiskers further extend by ±1.5 times the interquartile range from the limits of each box. N of biologically independent samples: TN NME4: 99, TM NME4: 96, TN P2RX4: 89, TM P2RX4: 89. P values were derived using tensorQTL and corrected as described in Methods. d, Pairwise comparison of eGenes shared between cell subpopulation. Only subpopulations with >100 eGenes were analyzed. e, Scatter plot showing the correlation between number of cells per donor and number of detected eGenes in each cluster. f, Subpopulation-specific eQTLs detected in IFN-responsive clusters. Bar plot (top) indicates the number of eGenes detected in the IFN-responsive subpopulation that are shared with naive T cells as a whole. Boxplots (bottom) show an example eQTL specific to this subpopulation. Each dot represents a measurement from a separate individual. Central lines indicate the median, with boxes extending from the 25th to the 75th percentiles. Whiskers further extend by ±1.5 times the interquartile range from the limits of each box. N of biologically independent samples: TN IFN FBXL18: 96, TN FBXL18: 87, P values were derived using tensorQTL and corrected as described in Methods. g, Number of subpopulation-specific eQTLs detected in TCM and TEM cells. Bar plots (top) indicate numbers of eGenes detected in TCM and TEM subpopulations that are shared with memory T cells as a whole. Boxplots (bottom) show an example eQTL specific to the TCM subpopulation. Each dot represents a measurement obtained from a separate individual. Central lines indicate the median, with boxes extending from the 25th to the 75th percentiles. Whiskers further extend by ±1.5 times the interquartile range from the limits of each box. N of biologically independent samples: TCM GNPDA1: 100, TEM GNPDA1: 103, TM GNPDA1: 97. P values were derived using tensorQTL and corrected as described in Methods. ER, endoplasmic reticulum; nTreg, natural regulatory T cells.

