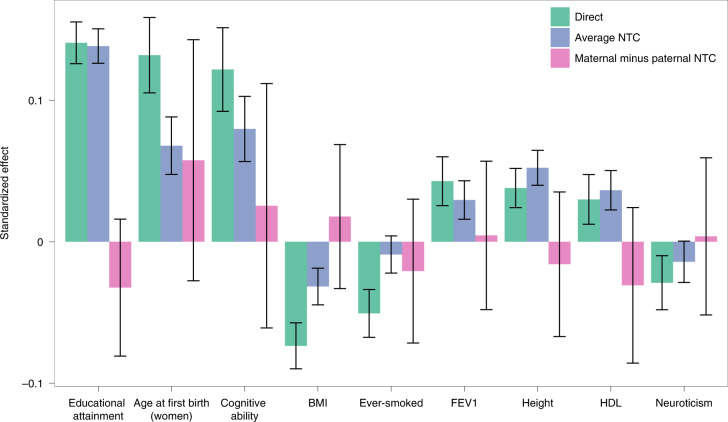
Fig. 4. Decomposition of the EA PGI effect assuming no indirect sibling effects.
The standardized effect estimate (standard deviation (s.d.) change in phenotype per s.d. change in PGI) is given along with the 95% confidence interval. Estimates were derived from a sample of 39,619 individuals with imputed and/or observed parental genotypes. Effects were estimated by joint regression of individuals’ phenotypes onto their own PGI, and their mother’s and father’s (imputed or observed) PGIs (Methods). We give the average of the estimated maternal and paternal NTCs, adjusted for bias due to imputation in the presence of AM (Methods), as the ‘average NTC’ here, and the difference between maternal and paternal NTCs as ‘maternal minus paternal’. Phenotypes were adjusted for 40 genetic PCs before analysis. HDL, high-density lipoprotein cholesterol; BMI, body mass index; FEV1, forced expiratory volume in one second.

