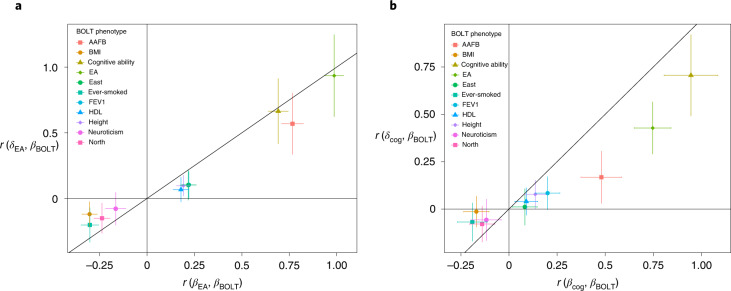
Fig. 6. Correlations between population effects from an independent sample and direct and population effects on EA and cognitive ability.
We computed correlations between summary statistics from our main analysis of 39,619 individuals from the ‘White British’ subsample of the UKB, where parental genotypes were imputed or observed, and population effects estimated by BOLT-LMM in an independent sample of 276,419 unrelated individuals from the ‘White British’ subsample of the UKB (Methods). a, Correlation between the population effects on EA estimated in our primary analysis and population effects for nine phenotypes and birth coordinates estimated in the unrelated sample, , on the x axis; and the correlation between the direct effects on EA estimated in our primary analysis and the population effects in the unrelated sample, , on the y axis. b, Correlation between the population effects from the unrelated sample and direct effects on cognitive ability, r(δcog, βBOLT), on the y axis; and the correlation between the population effects in the unrelated sample and population effects on cognitive ability from our primary analysis, , on the x axis. The vertical error bars give the 95% confidence intervals for the correlation with the direct effects, and the horizontal error bars give the 95% confidence intervals for the correlation with population effects. We give numerical results along with P values for differences between correlations with direct and population effects in Supplementary Table 7. AAFB, age at first birth (in women); north, north birth coordinate; east, east birth coordinate.

